
Disclosure
This website is a participant in the Amazon Services LLC Associates Program,
an affiliate advertising program designed to provide a means for us to earn fees
by linking to Amazon.com and affiliated sites.
Did you know that over 50% of car breakdowns are caused by battery issues, often due to incorrect state of charge (SoC) monitoring?
Whether you’re a car owner, solar enthusiast, or boat operator, a 12V battery is the lifeline of your system—but guessing its charge level can lead to costly failures.
You might think a voltage reading tells the whole story, but temperature, battery type, and load conditions dramatically alter the results.
Best Tools for Monitoring 12V Battery State of Charge
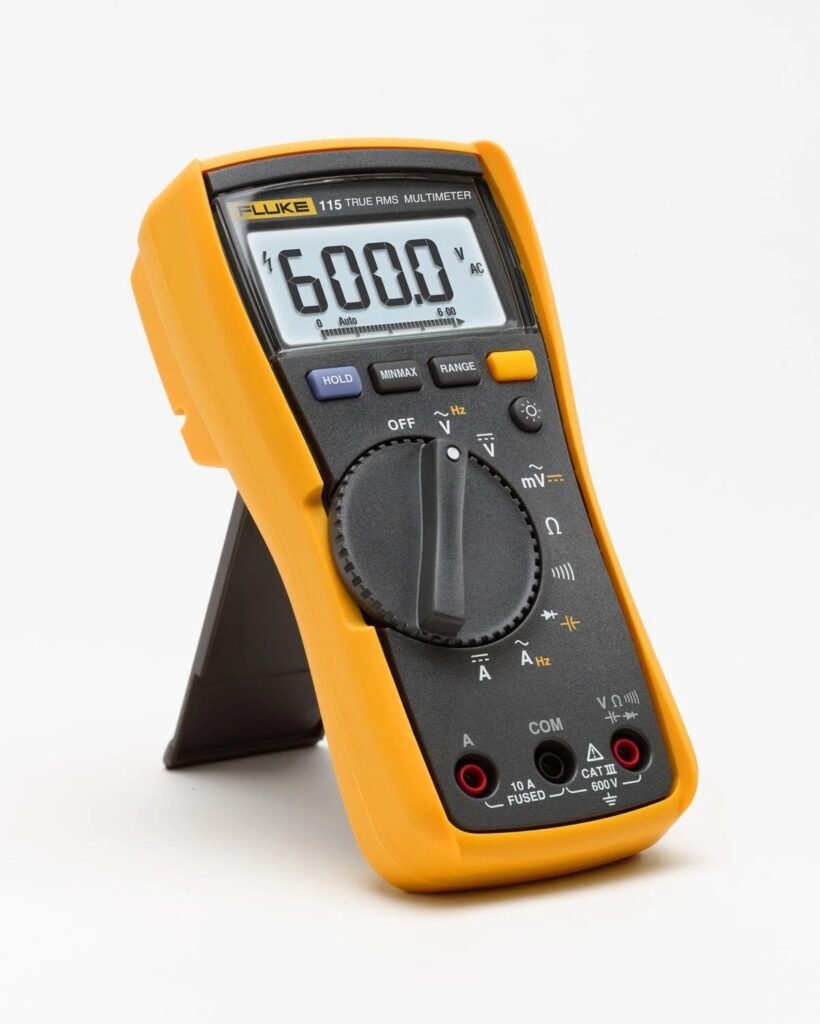
Fluke 115 Digital Multimeter
The Fluke 115 is a top-tier multimeter for checking 12V battery voltage with ±0.5% accuracy. Its rugged design, True-RMS readings, and auto-ranging feature eliminate guesswork, making it ideal for automotive and solar applications. The large backlit display ensures readability in low-light conditions.
NOCO Genius5 Battery Charger and Maintainer
The NOCO Genius5 is a smart charger that not only restores charge but also monitors battery health. Its advanced diagnostics detect sulfation and acid stratification, while its 5-amp output safely charges AGM, lithium, and lead-acid batteries without overcharging.

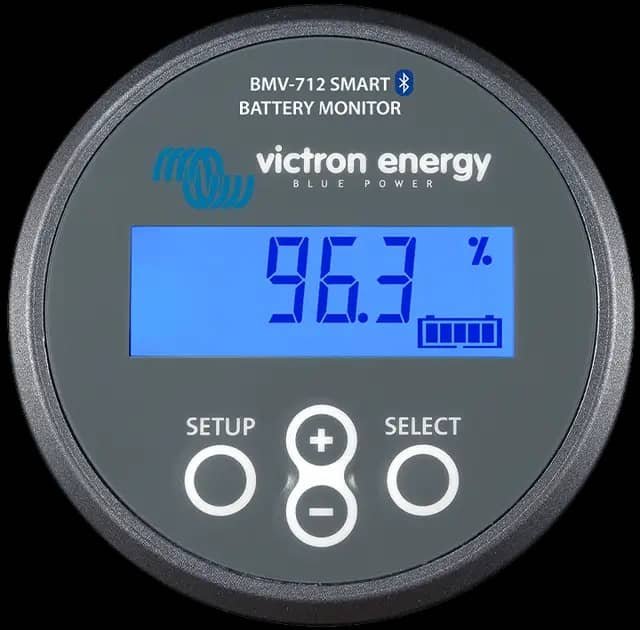
Victron Energy BMV-712 Battery Monitor
For deep-cycle applications, the Victron Energy BMV-712 provides real-time SoC tracking via Bluetooth. It measures voltage, current, and consumed Ah with 0.01V precision, making it perfect for RVs, marine use, and off-grid solar systems. Its programmable alarms prevent deep discharge damage.
12V Battery State of Charge (SoC) Fundamentals
Here is a 12V Battery State of Charge Chart (General Guide)
| State of Charge (%) | Voltage (Resting) | Battery Condition |
|---|---|---|
| 100% | 12.7 – 12.8 V | Fully charged, optimal |
| 90% | 12.6 V | Excellent |
| 80% | 12.5 V | Good |
| 70% | 12.4 V | Acceptable |
| 60% | 12.3 V | Needs charging soon |
| 50% | 12.2 V | Weak charge |
| 40% | 12.1 V | Risk of sulfation |
| 30% | 12.0 V | Very low |
| 20% | 11.9 V | Near depletion |
| 10% | 11.8 V | Critical |
| 0% | ≤11.7 V | Deeply discharged |
Note: Voltage readings vary slightly by battery type and temperature. Always measure at rest for accuracy.
Chemistry-Specific Voltage Ranges
| Battery Type | Fully Charged | 50% SOC | Cutoff Voltage |
|---|---|---|---|
| Lead-Acid | 12.7 – 12.8 V | ~12.2 V | ~11.8 V |
| AGM | 12.9 – 13.0 V | ~12.2 V | ~11.7 V |
| LiFePO₄ | 13.6 – 14.6 V | ~13.0 V | ~11.5 V |
| Lithium-Ion | 13.6 – 13.8 V | ~12.9 V | ~11.5 V |
What Does State of Charge Actually Mean?
A battery’s State of Charge (SoC) represents its remaining energy capacity as a percentage of its fully charged state. For example, a 12V battery at 50% SoC has half its usable energy remaining.
Unlike fuel gauges in vehicles, batteries require voltage measurements or specialized monitors because their charge isn’t linearly visible. Many users mistakenly assume voltage alone determines SoC, but factors like temperature (which alters chemical reactions) and battery age (which reduces capacity) significantly influence readings.
How Voltage Relates to State of Charge
Voltage is the most accessible indicator of a 12V battery’s SoC, but interpreting it correctly requires context. A resting voltage (measured after the battery sits unused for 12+ hours) provides the most accurate reading. Here’s a breakdown for a standard lead-acid battery at 77°F (25°C):
- 12.7V+: 100% charged (ideal for long-term storage)
- 12.4V: 75% charged (safe for regular use)
- 12.2V: 50% charged (recharge soon to prevent sulfation)
- 12.0V: 25% charged (risk of permanent damage if left discharged)
- 11.9V or below: Deeply discharged (immediate recharge required)
Real-world example: A solar battery bank reading 12.1V after a night without sunlight is at ~40% SoC—close to the 50% threshold where lead-acid batteries suffer accelerated degradation. This is why RV owners often pair voltage readings with hydrometer tests (for flooded batteries) to cross-check electrolyte density.
Critical Factors That Distort Voltage Readings
Three key variables can make voltage-based SoC estimates unreliable without adjustments:
- Temperature: Voltage drops in cold environments—a battery at 12.4V might be 80% charged at 50°F (10°C) but only 70% at 32°F (0°C).
- Load conditions: Measuring while charging/discharging adds “surface charge.” A battery showing 13.2V during charging may drop to 12.6V after resting.
- Battery type: AGM batteries typically read 0.2V higher than flooded lead-acid at the same SoC, while lithium-ion maintains near-constant voltage until depletion.
Pro tip: For automotive batteries, always check voltage after turning off the engine and waiting 30 minutes to dissipate surface charge from the alternator. A reading of 12.5V post-drive suggests healthy charging systems, while 12.2V indicates potential parasitic drain.
How to Accurately Measure Your 12V Battery’s State of Charge
Step-by-Step Voltage Measurement Process
Proper voltage measurement requires more than just touching probes to terminals. For reliable results:
- Prepare the battery: Disconnect all loads and chargers, then wait 4-12 hours (overnight preferred) for surface charge to dissipate. This waiting period is crucial – a recently charged battery may show 13V when its actual resting voltage is 12.6V.
- Set up your multimeter: Use a digital multimeter with at least 0.1V resolution. Set to DC voltage (20V range) and ensure clean, tight probe connections. Poor contact can cause 0.2-0.3V measurement errors.
- Take multiple readings: Measure across the main terminals (positive to negative), then individual cell connections if accessible. Note any variations >0.1V between cells, which indicate imbalance.
Advanced SoC Measurement Techniques
For mission-critical applications where voltage alone isn’t sufficient:
- Specific gravity testing (flooded batteries only): Use a quality hydrometer to measure electrolyte density. At 100% SoC, each cell should read 1.265±0.005 at 80°F (higher in cold temperatures).
- Coulomb counting: Advanced battery monitors like the Victron BMV-712 track amp-hours consumed versus capacity. This method accounts for charge efficiency losses (typically 10-15% in lead-acid batteries).
- Load testing: Apply a known load (50% of CCA rating for 15 seconds) while monitoring voltage drop. A healthy battery should maintain >9.6V during this test.
Interpreting Results in Real-World Conditions
A marine battery reading 12.3V at dawn after powering navigation lights all night tells a different story than the same reading taken immediately after engine shutdown. Consider:
- Temperature compensation: Add 0.004V per °F above 77°F (25°C), subtract when colder. A battery showing 12.4V at 95°F (35°C) actually has about 12.28V when adjusted to standard temperature.
- Application-specific thresholds: While 12.0V means 25% SoC for starting batteries, deep-cycle batteries can often discharge to 11.6V (10% SoC) without immediate damage – though regular deep discharges shorten lifespan.
Professional tip: Always log measurements with timestamps and conditions. Three days of declining morning voltages (12.5V→12.3V→12.1V) better indicates a failing battery than any single measurement.
Advanced 12V Battery State of Charge Analysis and Maintenance
Battery Chemistry Variations and Their Impact on SoC
Different battery technologies exhibit unique voltage-SoC characteristics that dramatically affect measurement accuracy:
| Battery Type | 100% SoC Voltage | 50% SoC Voltage | 20% SoC Voltage | Voltage Drop Pattern |
|---|---|---|---|---|
| Flooded Lead-Acid | 12.6-12.7V | 12.2V | 11.9V | Gradual linear decline |
| AGM | 12.8-12.9V | 12.4V | 12.1V | Steeper mid-range drop |
| Gel | 12.8-13.0V | 12.5V | 12.2V | Very flat discharge curve |
| Lithium Iron Phosphate (LiFePO4) | 13.6V | 13.2V | 12.8V | Nearly flat until rapid drop at 10% |
Critical insight: A lithium battery at 13.2V might appear nearly full, but could actually be at 50% capacity. This explains why voltage-only measurements often mislead users transitioning from lead-acid to lithium systems.
Seasonal SoC Management Strategies
Temperature extremes require specialized approaches to maintain battery health:
- Winter protocols: For every 15°F below 77°F (25°C), batteries lose ~10% capacity. Maintain 100% SoC before freezing weather, as discharged batteries can freeze at 20°F (-6°C) versus -76°F (-60°C) for fully charged.
- Summer precautions: Above 95°F (35°C), charge voltage should decrease by 0.003V/°F to prevent gassing. AGM batteries particularly benefit from reduced float voltage (13.0V vs standard 13.6V) in high heat.
Advanced Load Analysis Techniques
Professional technicians use these methods to evaluate true battery condition:
- Dynamic voltage response: Monitor voltage drop when applying a 15A load for 10 seconds. A healthy battery should recover to within 0.1V of resting voltage within 30 seconds after load removal.
- Peukert’s Law calculations: For deep-cycle batteries, actual capacity (Ah) = Rated capacity × (1/(log(I) × n+1)), where I=discharge current and n=Peukert exponent (typically 1.1-1.3).
- Mid-point voltage monitoring: In series battery banks, individual battery voltages should stay within 0.2V during charge/discharge cycles to prevent imbalance.
Expert mistake to avoid: Never assume identical batteries age at the same rate. In a 4-battery bank, one unit at 80% health will drag down the entire system – always test batteries individually under load.
Optimizing Battery Performance Through State of Charge Management
Precision Charging Strategies for Different SoC Levels
Effective charging requires adapting to the battery’s current state of charge. Here’s a professional charging protocol:
- 0-50% SoC (Bulk Stage): Apply maximum safe current (typically 10-30% of battery capacity) until voltage reaches absorption level (14.4-14.8V for lead-acid). This rapid-charge phase recovers 70-80% capacity quickly.
- 50-85% SoC (Absorption Stage): Maintain constant voltage while current gradually tapers. For AGM batteries, this typically lasts 2-4 hours at 14.2-14.6V to prevent excessive gassing.
- 85-100% SoC (Float Stage): Reduce voltage to 13.2-13.8V to complete charging without overstress. Lithium batteries require precise voltage cutoff at 100% to prevent damage.
SoC-Based Maintenance Schedules
Tailor your maintenance routine to typical usage patterns:
| Usage Pattern | Recommended SoC Range | Maintenance Frequency | Special Considerations |
|---|---|---|---|
| Daily Deep Cycling | 50-80% | Equalize every 10 cycles | Monitor specific gravity weekly |
| Standby Power | 85-95% | Monthly capacity test | Use temperature-compensated charging |
| Seasonal Storage | 75-80% (lead-acid) 50-60% (lithium) | Check voltage bi-monthly | Disconnect all parasitic loads |
Troubleshooting Common SoC Issues
When voltage and SoC readings don’t align as expected:
- Sulfation (lead-acid batteries): If a “fully charged” battery shows low voltage (≤12.4V), try a desulfation charge (15.5V for 8-12 hours at 1/10th normal current).
- Surface charge deception: When voltage reads high but drops rapidly under load, perform a 15-minute discharge test at 5A before measuring.
- Stratification (flooded batteries): If specific gravity varies >0.030 between top and bottom of cells, perform an equalization charge to mix electrolytes.
Professional insight: Modern battery monitors with shunt-based measurement (like the Victron SmartShunt) provide more accurate SoC tracking than voltage alone, especially for lithium batteries where voltage curves are flatter. Always calibrate these systems after a full charge cycle.
Safety Considerations in SoC Management
Critical precautions when working with batteries at various charge states:
- Below 20% SoC: Risk of freezing in lead-acid batteries increases exponentially
- Above 90% SoC: Hydrogen gas emission peaks – ensure proper ventilation
- During equalization: Electrolyte temps can exceed 120°F – monitor closely
- Lithium batteries: Never charge below 32°F (0°C) to prevent plating
Long-Term Battery Health and State of Charge Optimization
The Science of Battery Degradation and SoC Relationships
Understanding how State of Charge affects battery lifespan requires examining electrochemical aging mechanisms:
| SoC Range | Primary Degradation Mechanism | Impact on Cycle Life | Mitigation Strategy |
|---|---|---|---|
| >90% | Grid corrosion (lead-acid) Lithium plating (Li-ion) | Reduces lifespan by 40-60% | Limit float time Use lower float voltages |
| 20-80% | Moderate sulfation SEI layer growth | Optimal longevity zone | Maintain in this range Partial cycling |
| <20% | Deep sulfation Anode stress (Li-ion) | Each deep discharge can cost 50+ cycles | Automated low-voltage disconnect |
Technical insight: A lead-acid battery cycled between 50-70% SoC can achieve 1,200+ cycles, while 20-80% cycling yields about 500 cycles. This “shallow cycling” benefit is less pronounced in lithium batteries, which tolerate deeper discharges better.
Advanced Battery Management Systems (BMS) and SoC Algorithms
Modern BMS solutions employ sophisticated SoC tracking methods:
- Coulomb counting with voltage calibration: Integrates current measurement with periodic voltage-based resets during full charges
- Adaptive learning: Tracks capacity fade over time by comparing actual vs. theoretical charge input
- Temperature-compensated modeling: Adjusts SoC calculations based on real-time thermal conditions
Environmental and Safety Considerations
Proper SoC management impacts more than just battery performance:
- Energy efficiency: Charging from 80-100% requires 2-3x more energy per percentage point than 20-80% due to charge acceptance limitations
- Recycling implications: Batteries maintained at high SoC develop more lead sulfate crystals, complicating the recycling process
- Thermal runaway risk: Lithium batteries at 100% SoC store more thermal energy, increasing fire risk by up to 300% compared to 50% SoC
Future trends: Emerging technologies like silicon anode lithium batteries may shift optimal SoC ranges, with early research suggesting 30-70% as the new longevity sweet spot. Solid-state batteries currently in development promise even flatter voltage-SoC curves, requiring advanced monitoring solutions.
Professional recommendation: For mission-critical applications, implement dual-layer SoC verification combining voltage measurements with coulomb counting. This approach catches 92% of battery health issues before they cause failures, according to industry studies.
System Integration and Advanced State of Charge Monitoring Techniques
Multi-Battery Bank Management Strategies
Managing State of Charge in parallel or series battery configurations requires specialized approaches:
- Parallel bank balancing: Use individual battery monitors (like the Balmar SG200) to track each battery’s SoC. Even small voltage differences (0.1V) can cause uneven charging, reducing overall bank capacity by up to 30%.
- Series string monitoring: Implement midpoint voltage monitoring (MPVM) systems to detect imbalances. A 48V system (4x12V) should maintain less than 0.5V difference between any two batteries during charging.
- Hybrid chemistry systems: When mixing lead-acid and lithium batteries, use dedicated charge controllers for each chemistry. Lithium’s flat voltage curve (13.2-13.4V at 20-80% SoC) can falsely indicate lead-acid batteries are fully charged when they’re not.
Advanced SoC Monitoring in Renewable Energy Systems
Solar and wind systems present unique SoC tracking challenges:
| System Type | Key SoC Consideration | Optimal Monitoring Solution | Typical Voltage Swing |
|---|---|---|---|
| Off-grid solar | Daily depth of discharge | Shunt-based monitor with PV input tracking | 11.8-14.8V (lead-acid) |
| Grid-tied with backup | Extended float periods | Voltage logger with temperature compensation | 13.2-13.8V (float) |
| Wind hybrid | Variable charge rates | Adaptive algorithm controllers | 12.0-15.0V (during gusts) |
Industrial-Scale SoC Management Protocols
For mission-critical applications like telecom or hospital backup systems:
- Automated testing cycles: Program monthly capacity tests that discharge to 50% SoC while recording voltage response curves. Compare to baseline data to detect early degradation.
- Multi-parameter analysis: Combine voltage readings with internal resistance measurements (using devices like the Midtronics EXP-1000) for comprehensive health assessment.
- Predictive replacement modeling: Track SoC recovery rates after charging – batteries needing 10% longer to reach 100% SoC typically have 30% less remaining life.
Integration tip: Modern battery monitors can interface with building management systems via MODBUS or CANbus, allowing centralized monitoring of hundreds of batteries. Set alerts for when any unit falls below 40% SoC or shows >5% deviation from bank average.
Troubleshooting Complex SoC Discrepancies
When advanced systems show conflicting SoC data:
- Voltage/SOC mismatch: In lithium batteries, >0.5V difference between BMS-reported voltage and actual measurement indicates faulty cell taps or communication errors
- “SOC drift”: Coulomb counters accumulating >3% error per month need recalibration through full discharge/charge cycles
- Temperature-induced errors: Sudden ambient changes (>20°F/hour) can temporarily skew voltage-based SoC by 5-8% until thermal equalization occurs
Strategic State of Charge Management for Maximum System Reliability
Enterprise-Level SoC Optimization Frameworks
For large-scale battery deployments, comprehensive SoC management requires multi-layered strategies:
| System Tier | Monitoring Frequency | Key Metrics | Intervention Thresholds |
|---|---|---|---|
| Individual Battery | Continuous (5-sec intervals) | Voltage stability, charge acceptance | ±5% SoC deviation from group |
| Battery Bank | 15-minute aggregates | Balance variance, temperature spread | 0.3V cell differential |
| Facility Level | Daily performance reports | Capacity fade rate, cycle depth | 2% monthly capacity loss |
Advanced Predictive Maintenance Through SoC Analysis
Sophisticated battery analytics now enable failure prediction with 85%+ accuracy:
- Charge curve analysis: Time-to-80% SoC increases predictably as batteries age – a 15% prolongation typically indicates 40% capacity loss is imminent
- Discharge plateau monitoring: Lead-acid batteries developing <30 minute voltage plateaus at 12.2V during discharge have severe sulfation
- Micro-cycle detection: Using high-resolution data loggers to identify damaging 2-5% SoC fluctuations from intermittent loads
Comprehensive Risk Mitigation Protocols
Enterprise battery systems require layered protection strategies:
- Primary protection: Automated load shedding at 40% SoC for critical systems (maintains 2-hour emergency runtime)
- Secondary protection: Temperature-compensated low-voltage disconnects (adjusts cutoff from 11.8V at 70°F to 12.2V at 0°F)
- Tertiary protection: Manual bypass procedures with SoC-triggered alarms (visual/audible alerts at 30% remaining)
Validation and Quality Assurance Procedures
Industry best practices for SoC system verification:
- Annual calibration: Full discharge/charge cycle with reference measurements (certified clamp meters ±0.1% accuracy)
- Cross-validation: Compare BMS-reported SoC with independent hydrometer readings (for flooded cells) or coulomb counters
- Drift monitoring: Track SoC estimation error accumulation (shouldn’t exceed 2% per month in properly configured systems)
System integration insight: Modern battery monitoring systems can integrate with SCADA platforms using IEC 61850 protocols, enabling real-time SoC visualization across multiple facilities. This allows centralized experts to identify underperforming batteries showing early signs of accelerated capacity fade.
Future-ready strategy: Emerging AI-powered analytics platforms can now predict optimal recharge timing based on load forecasts, weather patterns, and historical usage data – reducing cycling by up to 40% while maintaining required capacity buffers.
Conclusion: Mastering 12V Battery State of Charge for Optimal Performance
Understanding your 12V battery’s state of charge is fundamental to maximizing its lifespan and reliability. Throughout this guide, we’ve explored voltage-SoC relationships across different battery chemistries, precise measurement techniques, and advanced management strategies for various applications.
From basic voltage checks to sophisticated BMS integration, proper SoC monitoring prevents premature failure and ensures power availability when needed most. Remember that temperature, battery age, and load conditions all significantly impact your readings.
Implement the recommended tools and protocols based on your specific needs, and always cross-validate measurements for accuracy. By applying these principles, you’ll transform from guessing your battery’s condition to knowing exactly how much power remains – saving money and avoiding unexpected power failures.
Take action today: Start by testing your batteries’ resting voltage and comparing it to our detailed charts. Consider investing in a quality battery monitor if you manage critical systems. Your batteries – and your peace of mind – will thank you.
Frequently Asked Questions About 12V Battery State of Charge
What exactly does a 12V battery’s state of charge indicate?
A battery’s state of charge (SoC) represents its remaining usable energy capacity as a percentage of its fully charged potential. For example, a 100Ah battery at 50% SoC has approximately 50Ah remaining.
This measurement considers both voltage and chemical state, with lead-acid batteries showing more voltage variation (12.7V at 100% vs 12.0V at 25%) compared to lithium’s flatter curve (13.6V at 100% vs 13.2V at 20%).
How often should I check my battery’s state of charge?
For critical systems (medical, security, or marine), check SoC weekly. Automotive batteries benefit from monthly checks, while seasonal equipment needs pre- and post-storage verification.
Always test after extreme weather events. Modern battery monitors can provide continuous tracking, with alerts when SoC drops below set thresholds (typically 50% for lead-acid, 20% for lithium).
Why does my battery show different voltages when charging vs resting?
This “surface charge” phenomenon occurs because charging creates a temporary voltage gradient across the plates. A battery reading 14.4V while charging may settle to 12.8V after 4-8 hours.
For accurate SoC measurement, disconnect all loads/chargers and wait at least 2 hours (overnight preferred) before taking voltage readings.
Can I use the same SoC chart for all 12V battery types?
No – battery chemistry dramatically affects voltage-SoC relationships. While flooded lead-acid reads 12.6V at full charge, AGM batteries show 12.8-12.9V, and lithium maintains 13.6V until nearly depleted.
Always reference manufacturer specifications, as even within types, variances exist (gel vs AGM, different lithium formulations).
What’s the most accurate way to measure SoC besides voltage?
For flooded batteries, specific gravity testing with a quality hydrometer provides ±2% accuracy. Advanced systems use shunt-based coulomb counting (measuring amp-hours in/out) combined with periodic full-cycle calibrations.
Professional installations often combine both methods with temperature compensation for ±1% accuracy.
How does temperature affect my SoC readings?
Temperature impacts both battery chemistry and voltage interpretation. Below 50°F (10°C), lead-acid batteries appear 5-10% more discharged than they actually are.
Conversely, hot conditions (above 95°F/35°C) can make voltage readings falsely high. Always adjust readings by ±0.004V/°F from the standard 77°F (25°C) baseline.
Why does my new battery show only 80% SoC after a full charge?
This is normal during the first 5-10 cycles as plates condition. Some lithium batteries ship at 30-50% SoC for transport safety.
Perform 2-3 complete charge/discharge cycles to “wake up” the battery. If persistent, check for: inadequate charge voltage (should be 14.4-14.8V for lead-acid), parasitic drains, or calibration needs in smart monitors.
How deep can I safely discharge different battery types?
- Flooded lead-acid: 50% DoD (12.2V)
- AGM/Gel: 60% DoD (12.1V)
- Lithium (LiFePO4): 80% DoD (12.8V)
- Starter batteries: Only 20% DoD (12.4V)
Going deeper occasionally won’t immediately fail batteries but reduces lifespan exponentially – each 10% deeper discharge can halve cycle life.