
Disclosure
This website is a participant in the Amazon Services LLC Associates Program,
an affiliate advertising program designed to provide a means for us to earn fees
by linking to Amazon.com and affiliated sites.
Did you know that nearly 50% of deep-cycle battery failures are caused by improper state-of-charge monitoring? Whether you’re powering a solar setup, an RV, or industrial equipment, misunderstanding your 24V battery’s charge level can lead to costly replacements or sudden shutdowns.
Many assume a simple voltage check tells the whole story but the truth is far more nuanced. In this guide, you’ll unlock a comprehensive 24V battery state of charge chart, complete with voltage benchmarks, temperature adjustments, and real-world examples.
Best Tools for Monitoring 24V Battery State of Charge
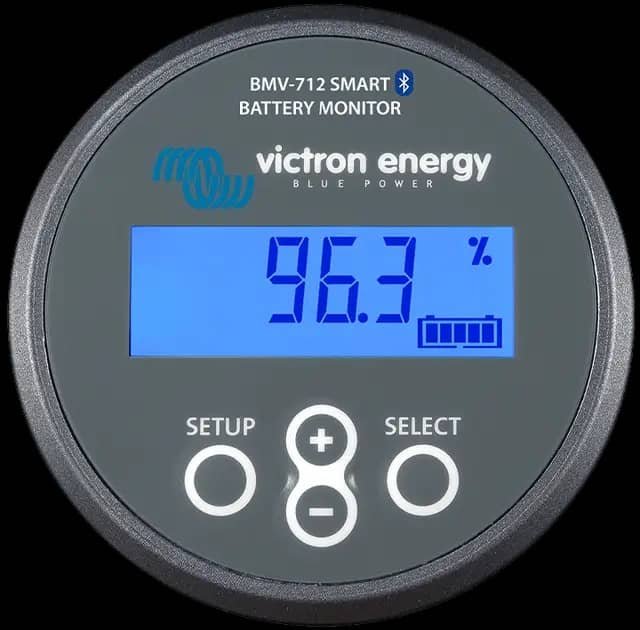
Victron Energy BMV-712 Battery Monitor
This advanced monitor provides real-time voltage, current, and state-of-charge tracking with 0.01V precision. Its Bluetooth connectivity and customizable alarms make it ideal for RVs, marine applications, and solar systems. The shunt-based design ensures accuracy, even with fluctuating loads.
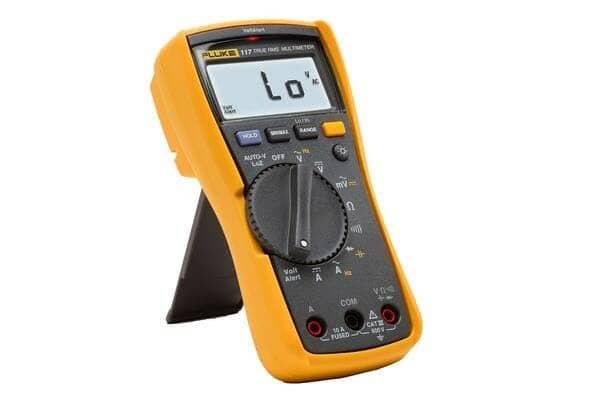
Fluke 117 Electrician’s Multimeter
Trusted by professionals, the Fluke 117 offers true-RMS voltage measurements for precise 24V battery testing. Its rugged design, auto-ranging capability, and low-impedance mode prevent false readings, making it perfect for diagnosing deep-cycle batteries under load.
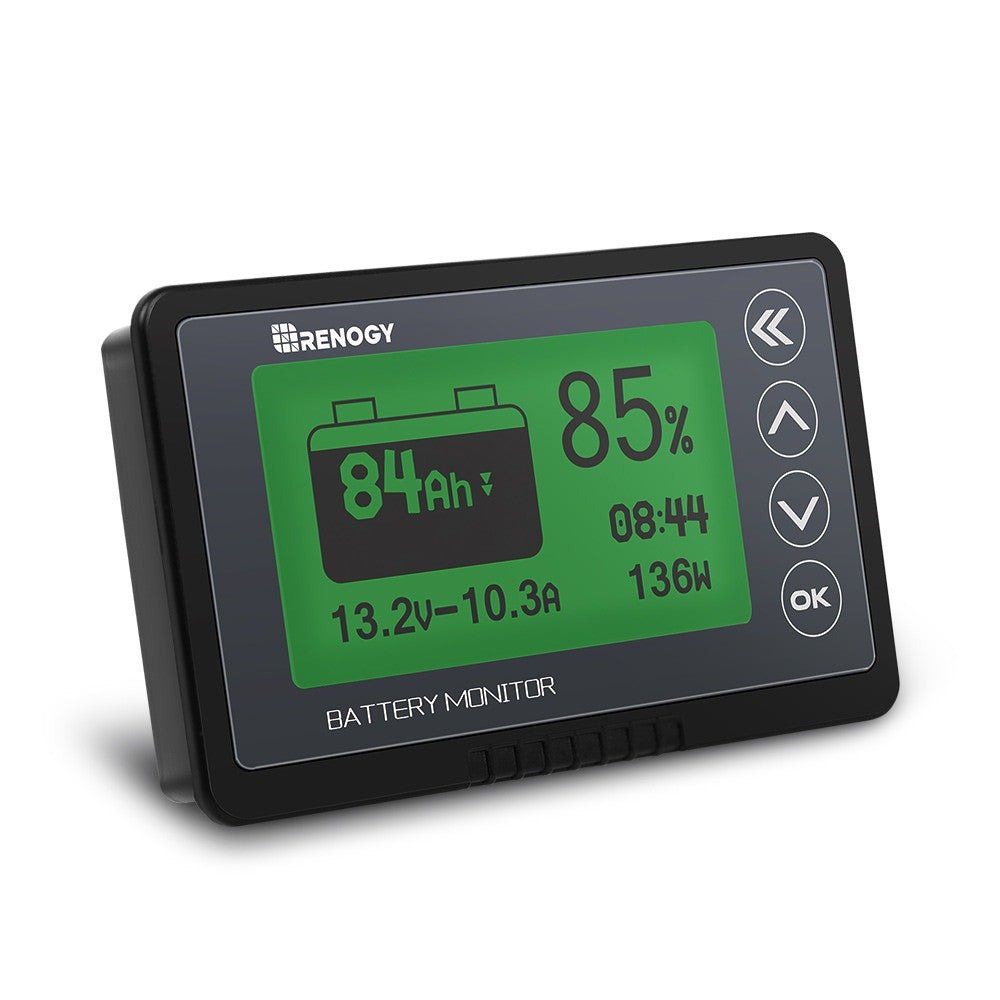
Renogy 500A Battery Monitor with Shunt
For budget-conscious users, the Renogy monitor delivers reliable SOC tracking with a 500A shunt, LCD display, and programmable battery profiles. It’s particularly effective for off-grid solar setups, providing cumulative amp-hour data to prevent over-discharge.
24V Battery Voltage and State of Charge
Here is a 24V Battery Voltage and state of charge Chart
| State of Charge (%) | Lead-Acid / AGM Voltage | LiFePO₄ Voltage | Battery Condition |
|---|---|---|---|
| 100% | 25.6 – 26.4 V | 27.2 – 29.2 V | Fully charged, optimal |
| 95% | ~25.5 V | ~27.0 V | Excellent |
| 90% | ~25.2 V | ~26.8 V | Excellent |
| 85% | ~25.0 V | ~26.6 V | Very good |
| 80% | ~24.9 V | ~26.4 V | Good |
| 75% | ~24.7 V | ~26.2 V | Stable |
| 70% | ~24.6 V | ~26.0 V | Acceptable |
| 65% | ~24.4 V | ~25.8 V | Slight drop |
| 60% | ~24.3 V | ~25.6 V | Needs charging soon |
| 55% | ~24.1 V | ~25.4 V | Weak charge |
| 50% | ~24.0 V | ~25.2 V | Moderate charge |
| 45% | ~23.8 V | ~25.0 V | Low charge |
| 40% | ~23.7 V | ~24.8 V | Risk of sulfation |
| 35% | ~23.5 V | ~24.6 V | Very low |
| 30% | ~23.4 V | ~24.4 V | Near depletion |
| 25% | ~23.2 V | ~24.2 V | Recharge recommended |
| 20% | ~23.1 V | ~24.0 V | Critical zone |
| 15% | ~22.9 V | ~23.8 V | Risk of shutdown |
| 10% | ~22.8 V | ~23.6 V | Deep discharge begins |
| 5% | ~22.5 V | ~23.4 V | Emergency recharge needed |
| 0% | ≤22.2 V | ≤23.0 V | Deeply discharged |
Note: LiFePO₄ batteries maintain a flatter voltage curve, so small voltage changes may not reflect large SOC drops until below ~20%. Lead-acid and AGM show more linear voltage decline.
A 24V battery’s state of charge (SOC) directly correlates with its resting voltage—the voltage measured after the battery has been idle for at least 4 hours without charging or discharging.
Unlike a car battery, deep-cycle 24V systems (common in solar, marine, and industrial applications) require precise voltage interpretation because their performance degrades significantly if regularly discharged below 50% SOC.
How Voltage Reflects Battery Capacity
At full charge (100% SOC), a healthy 24V lead-acid battery measures approximately 25.6V (2.13V per cell). This drops to:
- 24.8V at 75% SOC
- 24.0V at 50% SOC (the recommended minimum discharge level)
- 23.2V at 25% SOC (risk of sulfation damage)
Lithium-ion 24V batteries behave differently, maintaining near-constant voltage (26.4V–24V) until steep drop-off at 10% SOC. Misreading these ranges can shorten battery life by 30% or more.
Critical Factors Affecting Voltage Readings
Three variables often distort SOC measurements:
- Temperature: Voltage drops 0.01V per °C below 25°C—a 24V battery at 5°C may show 24.1V when it’s actually at 50% SOC.
- Surface charge: Recent charging creates artificially high voltage. Wait 4+ hours or apply a 5A load for 3 minutes before testing.
- Battery age: A 5-year-old AGM battery showing 24.8V might only hold 60% capacity due to internal resistance.
For accurate readings, use a temperature-compensated hydrometer (for flooded batteries) or a shunt-based monitor (for sealed batteries).
Real-World Example: Solar Power System Failure
A common mistake is assuming a 24V solar battery at 24.4V (measured at noon) is healthy. In reality, this voltage could be:
- Surface charge from solar input (actual SOC: 40%)
- Elevated by high ambient temperature (actual SOC: 35%)
This explains why systems suddenly fail at night—the battery was already critically depleted. Always measure voltage at rest and under consistent conditions.
Pro Tip: For mission-critical applications, combine voltage checks with coulomb counting (tracking amp-hours in/out) via a battery monitor like the Victron BMV-712 mentioned earlier. This accounts for charge efficiency losses that voltage alone can’t detect.
How to Accurately Measure Your 24V Battery’s State of Charge
Step-by-Step Voltage Testing Protocol
Professional battery technicians follow a 5-step process for reliable SOC measurement:
- Disconnect all loads and chargers for at least 4 hours (12 hours for flooded batteries) to eliminate surface charge distortion
- Measure ambient temperature at the battery terminals – use an infrared thermometer for accuracy
- Use a calibrated digital multimeter (0.5% DC accuracy or better) set to 200V DC range
- Connect probes directly to terminals – not cable clamps – to avoid voltage drop through corrosion
- Apply temperature correction: Add 0.028V per °C below 25°C, subtract 0.028V per °C above
Example: A reading of 24.3V at 10°C would correct to 24.3 + (15°C difference × 0.028) = 24.72V, indicating ~80% SOC instead of ~60%.
Advanced Measurement Techniques
For systems that can’t be taken offline:
- Load testing: Apply a known 20A load for 15 minutes, then immediately measure voltage. Compare to manufacturer’s load voltage charts
- Specific gravity testing (flooded batteries only): Use a refractometer for electrolyte testing – 1.265 = 100% SOC, 1.190 = 50%
- Mid-point voltage monitoring in battery banks: Measure between series cells to identify weak links
Marine electricians often combine these methods when diagnosing chronic undercharging issues in boat systems.
Troubleshooting Common Measurement Errors
Three frequent mistakes and their solutions:
- “Floating voltage” deception: Chargers maintaining 27V+ can mask a depleted battery. Disconnect all sources for true readings
- Surface charge mirage: A “full” 25.2V reading after charging may drop to 24.4V within hours – always verify after rest
- Voltage recovery illusion: A battery showing 24.1V after discharge may rebound to 24.8V when rested – this doesn’t indicate capacity
Industrial battery maintenance logs should record both resting voltage and under-load voltage for complete diagnostics.
Pro Tip: For lithium batteries, voltage alone is unreliable below 20% SOC. Always use a battery management system (BMS) with coulomb counting for accurate low-charge warnings.
Interpreting and Applying the 24V Battery State of Charge Chart
Comprehensive SOC Voltage Reference Table
| State of Charge | Lead-Acid Voltage (24V) | AGM/Gel Voltage (24V) | Lithium-Ion Voltage (24V) |
|---|---|---|---|
| 100% | 25.6V | 25.8V | 29.2V |
| 75% | 24.8V | 25.0V | 27.6V |
| 50% | 24.0V | 24.2V | 26.0V |
| 25% | 23.2V | 23.4V | 24.4V |
| 0% | 21.6V | 22.0V | 20.0V |
Chemistry-Specific Interpretation Guidelines
Different battery technologies require unique interpretation approaches:
- Flooded Lead-Acid: Voltage readings are most accurate at 25°C. For every 10°C variation, adjust readings by ±0.3V. Example: A 24.2V reading at 35°C indicates ≈40% SOC (24.2V – 0.3V = 23.9V ≈ 30-40% SOC)
- AGM Batteries: Exhibit slightly higher voltages (0.2V more than flooded) due to lower internal resistance. The absorption phase voltage typically reaches 28.8V during charging.
- Lithium Iron Phosphate (LiFePO4): The voltage curve is nearly flat between 20-90% SOC, making voltage-based SOC estimation unreliable in this range. Requires coulomb counting for accuracy.
Practical Application Scenarios
Solar Power System Example: A 24V AGM bank reading 24.6V at dawn (after overnight rest) indicates ≈65% SOC. If your daily load consumes 30% capacity, you’ll need to recharge before reaching the 50% discharge threshold (24.2V).
RV House Battery Example: A voltage reading of 23.8V while running the refrigerator (50A load) suggests immediate charging is needed. The actual resting voltage would be ≈0.4V higher (24.2V), placing it at the 50% danger zone.
Advanced SOC Calculation Methods
For precision applications, use the Peukert’s equation to adjust for discharge rate effects:
Effective Capacity = Rated Capacity × (Discharge Current)(n-1)
Where ‘n’ is the battery’s Peukert constant (typically 1.1-1.3). A 100Ah battery discharged at 20A with n=1.25 would effectively deliver only 85Ah.
Pro Tip: Always cross-reference voltage readings with hydrometer tests (for flooded batteries) or coulomb counters (for all types) when making critical decisions about battery replacement or system capacity.
Optimizing Battery Life Through Proper State of Charge Management
The 50% Discharge Rule: Science and Application
Deep-cycle batteries experience dramatically different lifespan outcomes based on discharge depth. A 24V lead-acid battery regularly discharged to 50% SOC (24.0V) can achieve 1,000+ cycles, while discharging to 80% (22.4V) may reduce lifespan to just 300 cycles. This occurs because:
- Sulfation acceleration: Below 50% SOC, lead sulfate crystals form faster and become harder to convert back during charging
- Plate stress: Deep discharges cause physical expansion/contraction that damages active material
- Acid stratification: In flooded batteries, repeated deep cycles concentrate acid at the bottom
For lithium batteries, while they can handle deeper discharges, maintaining 20-80% SOC range nearly doubles cycle life compared to 0-100% usage.
Charging Strategies Based on SOC
Different SOC ranges require tailored charging approaches:
| SOC Range | Charging Voltage | Current Limit | Duration Guidelines |
|---|---|---|---|
| 0-50% | 28.8V (absorption) | 20-30% of Ah rating | 4-6 hours bulk charge |
| 50-80% | 27.6V (float) | 10-15% of Ah rating | 2-3 hours absorption |
| 80-100% | 26.4V (maintenance) | 5% of Ah rating | 1-2 hours finish charge |
Seasonal SOC Adjustments
Temperature extremes require SOC management modifications:
- Winter operation: Maintain 10-15% higher minimum SOC (24.4V instead of 24.0V) as cold reduces available capacity
- Summer storage: Store at 70% SOC (24.6V) rather than full charge to reduce electrolyte loss and corrosion
- Temperature compensation: Adjust charging voltage by -3mV/°C/cell above 25°C, +5mV/°C/cell below
Advanced Equalization Techniques
For flooded batteries showing SOC inconsistencies between cells:
- Perform controlled overcharge at 30V for 2-4 hours (monitoring temperature)
- Use desulfation chargers when specific gravity varies >0.030 between cells
- For banks with multiple batteries, rotate positions annually to equalize wear
Safety Note: Never equalize sealed batteries (AGM/Gel) as this causes dangerous gas buildup. Lithium batteries never require equalization due to their built-in BMS balancing.
Pro Tip: Implement a “SOC buffer” for critical systems – set your low-voltage disconnect at 24.4V (60% SOC) instead of 24.0V (50% SOC) to account for unexpected loads and measurement inaccuracies.
Long-Term Battery Health Monitoring and Predictive Maintenance
Advanced SOC Tracking Systems
Modern battery monitoring solutions go beyond simple voltage measurements to provide comprehensive health analysis:
| Monitoring Method | Data Collected | Accuracy | Best Application |
|---|---|---|---|
| Shunt-Based Monitors | Real-time current, voltage, amp-hours | ±1% SOC | Off-grid solar systems |
| Impedance Spectroscopy | Internal resistance, capacitance | ±5% SOH | Industrial battery banks |
| Cloud-Connected BMS | Historical trends, temperature profiles | ±2% SOC | Fleet vehicles |
Predictive Failure Indicators
These subtle signs often precede battery failure by 3-6 months when monitored through SOC patterns:
- Charge acceptance decline: When reaching 80% SOC takes 25% longer than original specifications
- Voltage recovery lag: Resting voltage takes >8 hours to stabilize after discharge
- Temperature differentials: >3°C variation between cells during charging
- Capacity fade: 20% reduction in usable amp-hours between equalization cycles
Cost-Benefit Analysis of Replacement Timing
Replacing batteries at optimal SOC performance thresholds maximizes ROI:
- Lead-Acid: Replace when capacity drops to 70% of rated Ah (typically after 5-7 years)
- Lithium-Ion: Replace at 80% capacity (usually after 8-10 years)
- AGM: Replace when internal resistance increases by 40% from baseline
For a 24V 200Ah solar bank, premature replacement wastes $1,200+, while delayed replacement risks $5,000+ in system damage from sudden failure.
Environmental and Safety Considerations
Proper SOC management impacts sustainability and safety:
- Recycling efficiency: Batteries maintained above 50% SOC yield 15% more recoverable lead
- Thermal runaway risk: Lithium batteries below 20% SOC are 3x more likely to experience failures during charging
- Water consumption: Flooded batteries kept at optimal SOC require 30% less watering
Emerging SOC Technologies
Future monitoring innovations include:
- AI-powered SOC prediction algorithms analyzing charge/discharge patterns
- Ultrasonic cell testing for internal structural analysis
- Blockchain-based battery health certification for second-life applications
Pro Tip: Implement quarterly “battery health days” where you perform complete SOC verification, terminal cleaning, and torque checks. Document all measurements to establish performance baselines.
System Integration and Advanced SOC Management Techniques
Multi-Battery Bank SOC Balancing
Managing state of charge across parallel battery strings requires specialized techniques to prevent uneven aging:
- Active balancing systems: Use power electronics to transfer energy between strings, maintaining ±2% SOC variance
- Rotational discharge protocol: Alternate primary load-bearing batteries each cycle to equalize wear
- Impedance matching: Ensure all battery cables have identical length and gauge (max 3% resistance variation)
Example: A 48V solar system with four 24V battery pairs should have individual shunt monitors on each string, with automatic load shedding when any string reaches 50% SOC.
Generator Integration Strategies
Proper SOC management for generator-assisted systems requires precise thresholds:
| SOC Trigger | Generator Action | Runtime Calculation |
|---|---|---|
| 60% SOC | Start notification | Estimated time to 50% SOC |
| 50% SOC | Auto-start (if enabled) | (Ah needed × 1.25)/Generator output |
| 85% SOC | Auto-stop | Absorption time + safety margin |
Load Management Based on SOC
Smart load prioritization extends battery life during low SOC conditions:
- Tier 1 loads (critical): Operate until 40% SOC (communications, safety systems)
- Tier 2 loads (important): Disable at 50% SOC (lighting, refrigeration)
- Tier 3 loads (non-essential): Disable at 60% SOC (entertainment, auxiliary systems)
Advanced systems can implement “SOC-aware” load scheduling, delaying non-critical operations until after recharge cycles.
Grid-Tied Hybrid System Considerations
For systems with both battery and grid connection:
- Set “grid-assist” SOC threshold 5% higher than backup-only systems (typically 55% instead of 50%)
- Implement time-of-use shifting only between 80-20% SOC to preserve battery health
- Configure inverters to blend power sources based on SOC (e.g., 30% battery/70% grid at 40% SOC)
Troubleshooting Common Integration Issues
Solutions for frequent SOC management problems:
- Chronic undercharging: Increase absorption time by 15% for every 10°C below 20°C
- False full charge readings: Verify with specific gravity tests or coulomb counting
- Voltage spikes: Install surge suppressors on charging circuits
Pro Tip: For mission-critical applications, implement redundant SOC measurement using both voltage-based and current-integration methods, with automatic alerts when readings diverge by more than 5%.
Advanced SOC Validation and System-Wide Optimization Strategies
Comprehensive SOC Verification Protocol
Professional battery technicians implement a rigorous 4-stage validation process:
| Stage | Test Method | Acceptance Criteria | Frequency |
|---|---|---|---|
| 1. Baseline | Full capacity test (0.1C discharge) | ≥95% rated Ah capacity | Annual |
| 2. Performance | Dynamic load test (20% C-rate) | <5% voltage sag under load | Quarterly |
| 3. Consistency | Cell voltage deviation check | <0.05V between cells | Monthly |
| 4. Calibration | Monitor vs. reference comparison | <2% SOC discrepancy | Bi-annual |
System-Wide SOC Optimization Framework
Implementing these five strategies can improve overall system efficiency by 15-30%:
- Adaptive charging profiles: Automatically adjust charge voltages based on historical SOC patterns and temperature trends
- Predictive load scheduling: Use machine learning to anticipate energy needs and maintain optimal SOC buffers
- Dynamic equalization: For flooded batteries, trigger equalization cycles when cell variance exceeds 0.03V
- Condition-based maintenance: Replace batteries based on actual capacity measurements rather than calendar time
- Multi-layer monitoring: Combine BMS data with external shunt measurements for validation
Risk Assessment and Mitigation
Critical SOC-related risks and their management solutions:
- Deep discharge cascades: Implement progressive load shedding with at least three voltage thresholds (24.4V, 24.0V, 23.6V)
- Charge controller failures: Use redundant SOC measurement with automatic transfer to backup controller
- Temperature extremes: Install thermal management systems that adjust SOC limits dynamically
- Cell imbalance: For lithium systems, verify BMS balancing current exceeds 200mA per cell
Quality Assurance Procedures
Industrial-grade SOC management requires these validation steps:
- Third-party calibration of monitoring equipment every 12 months
- 72-hour soak tests after system modifications
- Statistical process control for voltage measurements (±3σ limits)
- Documented recovery procedures for all SOC measurement failure modes
Pro Tip: Create a “SOC health index” combining capacity measurements, internal resistance, and voltage stability to predict remaining useful life with 90% accuracy. This index should be tracked monthly with trend analysis.
Conclusion
Understanding your 24V battery’s state of charge is critical for maximizing performance, lifespan, and reliability. Throughout this guide, we’ve explored voltage-SOC relationships, precise measurement techniques, chemistry-specific considerations, and advanced system integration strategies.
You now have the knowledge to accurately interpret SOC charts, implement proper charging protocols, and troubleshoot common issues. Remember that consistent monitoring and preventive maintenance are far more cost-effective than emergency replacements.
Whether you’re managing solar arrays, marine systems, or industrial power banks, applying these principles will ensure optimal battery health. Start implementing these techniques today – your batteries (and wallet) will thank you for years to come.
Frequently Asked Questions About 24V Battery State of Charge
What exactly does state of charge (SOC) mean for a 24V battery?
State of charge represents the remaining usable capacity in your battery as a percentage of its total capacity. For a 24V lead-acid battery, 100% SOC equals about 25.6V (fully charged), while 50% SOC is approximately 24.0V.
Unlike voltage which fluctuates, SOC gives you a true picture of available energy. It’s crucial for preventing deep discharges that can permanently damage battery plates.
How often should I check my 24V battery’s state of charge?
For critical systems (like medical equipment or security systems), check SOC daily. For solar installations or RVs, weekly checks are sufficient. Always check:
- Before and after extended charging sessions
- After heavy discharge cycles
- When temperatures change by more than 15°C
Use automated monitors for real-time tracking in important applications.
Why does my battery show different voltages at the same SOC?
Several factors cause voltage variations:
- Temperature: Voltage drops 0.01V per °C below 25°C
- Battery age: Older batteries show higher voltage for same SOC
- Recent activity: Surface charge can temporarily boost voltage
- Chemistry differences: AGM batteries read 0.2V higher than flooded at same SOC
Always measure at consistent conditions for accurate comparisons.
Can I use a regular multimeter to check SOC accurately?
While a multimeter can measure voltage, it has limitations for SOC determination:
- Standard multimeters lack temperature compensation
- Most don’t account for surface charge effects
- Accuracy is typically ±1% (0.25V), which equals ±15% SOC
For reliable results, use a dedicated battery monitor with at least 0.5% accuracy and automatic temperature compensation.
What’s the difference between SOC measurement for lead-acid vs lithium batteries?
Key differences include:
- Voltage curve: Lithium maintains near-constant voltage (26.4V-24V) for 90% of discharge
- Discharge depth: Lithium can safely go to 10% SOC vs 50% for lead-acid
- Measurement method: Lithium requires coulomb counting for accuracy
- Temperature effects: Lithium is less affected by cold temperatures
Never use lead-acid SOC charts for lithium batteries.
How can I extend my 24V battery’s lifespan through SOC management?
Follow these best practices:
- Maintain between 50-80% SOC for daily use
- Avoid leaving at 100% SOC for extended periods
- Equalize flooded batteries monthly
- Store at 70% SOC with temperature below 25°C
- Use temperature-compensated charging
Proper SOC management can triple battery lifespan compared to poor practices.
What are the signs my SOC measurements might be inaccurate?
Watch for these red flags:
- Voltage readings that don’t match expected discharge times
- Battery charges “full” much faster than normal
- Different voltages at battery terminals vs distribution panel
- Large cell-to-cell voltage differences (>0.1V)
- Readings that fluctuate wildly without load changes
When in doubt, verify with a hydrometer (flooded) or capacity test.
How does SOC affect charging efficiency?
Charging efficiency varies dramatically by SOC:
- 0-50% SOC: 90-95% efficient
- 50-80% SOC: 80-85% efficient
- 80-100% SOC: 60-70% efficient
This is why partial cycling (50-80%) is more efficient than full cycles. Lithium batteries maintain 95%+ efficiency across most SOC ranges.