
Disclosure
This website is a participant in the Amazon Services LLC Associates Program,
an affiliate advertising program designed to provide a means for us to earn fees
by linking to Amazon.com and affiliated sites.
Did you know that using the wrong battery voltage can permanently damage your devices—or even pose a safety risk? Whether you’re replacing a car battery, powering a solar setup, or stocking up on AAAs for household gadgets, understanding standard voltage is non-negotiable.
Many assume all “12V” batteries are identical, but variations exist between chemistries, brands, and states of charge.
Best Multimeters for Testing Battery Voltage
Fluke 87V Digital Multimeter
The Fluke 87V is a professional-grade multimeter with True RMS accuracy, making it ideal for measuring battery voltage under load. Its rugged design, 0.1% DC voltage accuracy, and Min/Max recording help diagnose weak or failing batteries in cars, solar systems, and electronics.

Klein Tools MM720 Auto-Ranging Multimeter
For a budget-friendly yet reliable option, the Klein Tools MM720 offers auto-ranging voltage detection up to 600V, a backlit display, and a low battery indicator. Its compact size and durable build make it perfect for quick voltage checks on AA, AAA, and 12V batteries.

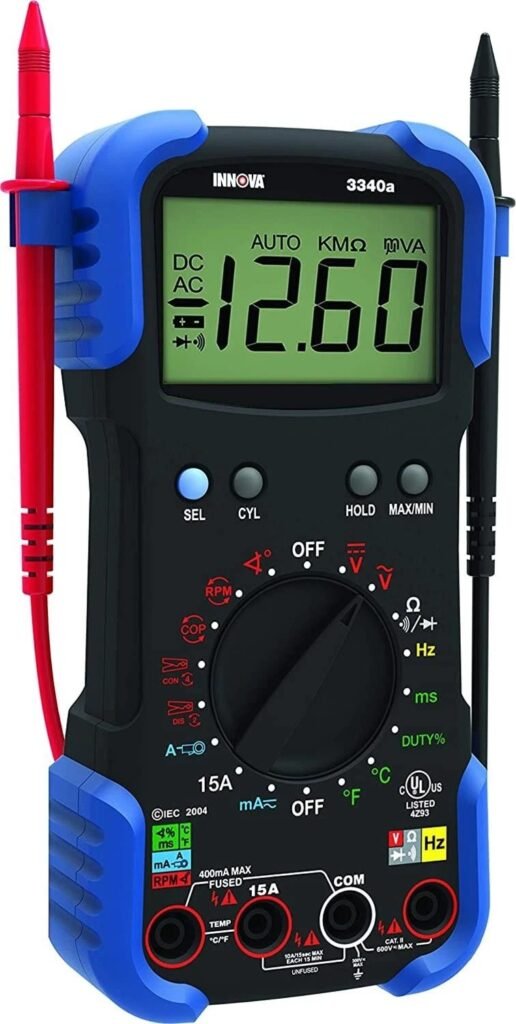
Innova 3340 Automotive Digital Multimeter
Designed for car batteries, the Innova 3340 includes a 10 MegOhm input impedance to prevent false readings. It tests 12V/24V systems, alternator ripple, and parasitic drain—essential for diagnosing weak car batteries before they leave you stranded.
Battery Voltage: The Complete Guide
What Is Battery Voltage and Why Does It Matter?
Battery voltage measures the electrical potential difference between its positive and negative terminals, determining how much energy it can deliver to a device. Unlike capacity (measured in amp-hours), voltage indicates the “pressure” pushing electrons through a circuit.
For example, a standard AA alkaline battery provides 1.5V when new, but drops to 1.2V when nearly depleted—a critical threshold for devices like digital cameras that may stop functioning despite residual charge.
Nominal vs. Actual Voltage: Key Differences
Most batteries list a nominal voltage (e.g., 12V for car batteries), which is an average value during discharge. However, actual voltage fluctuates:
- Lead-acid batteries: Fully charged at 12.6V–12.8V, but drop to 11.9V when discharged (below 12.0V risks sulfation damage).
- Lithium-ion batteries: Operate between 3.0V (empty) and 4.2V (full) per cell. A “3.7V nominal” 18650 cell actually spends most of its discharge cycle at 3.6V–3.8V.
Misunderstanding this leads to premature replacements—like assuming a 12V AGM battery at 12.3V is faulty, when it’s simply at 70% charge.
How Temperature and Load Affect Voltage
Voltage readings are meaningless without context. Two factors dramatically alter measurements:
- Temperature: Cold temperatures temporarily reduce voltage (e.g., a car battery at 0°F reads 0.3V–0.5V lower than at 80°F).
- Load: A 12V battery may show 12.6V at rest but plunge to 10V when starting an engine—indicating aging cells if it doesn’t recover to ~12.4V afterward.
Example: A drone’s LiPo battery might read 3.8V/cell after landing, but rebound to 3.9V after 10 minutes. Charging it immediately based on the lower reading risks overvoltage.
Voltage Ranges for Common Battery Types
Here’s how major chemistries compare:
- Alkaline (AA/AAA): 1.5V (new) → 1.0V (disposed). Devices often cut off at 1.2V.
- NiMH rechargeable: 1.2V nominal, but peaks at 1.4V when fully charged.
- Car batteries (lead-acid): 12.6V (100%) → 11.9V (0%). Never store below 12.4V.
Pro Tip: Lithium iron phosphate (LiFePO4) batteries have a flatter discharge curve, holding ~3.2V for 80% of their capacity—confusing users expecting voltage drops like lead-acid.
Practical Applications: When to Trust (or Distrust) Voltage
Voltage alone can’t diagnose all issues. A car battery at 12.4V might fail a load test due to internal resistance, while a swollen Li-ion pack at 4.1V could be unsafe. Always pair voltage checks with:
- Load testing (for starter batteries)
- Internal resistance measurements (for Li-ion)
- Capacity tests (for solar storage)
Example: Solar users often mistake a 12V battery at 13.2V as “overcharged,” but this is normal during absorption charging—actual problems appear if voltage stays high after disconnecting panels.
How to Accurately Measure Battery Voltage: Step-by-Step Guide
Choosing the Right Tools for Voltage Testing
Professional-grade testing requires more than a basic multimeter. For reliable results, you’ll need:
- Digital multimeter with 0.1% DC accuracy (like the Fluke 87V mentioned earlier) for precise measurements
- Insulated alligator clips to maintain stable connections during load testing
- Battery load tester for assessing voltage under real-world conditions
Example: Testing a car battery with just a voltmeter might show 12.4V (appearing healthy), but a load test could reveal it drops to 8V when starting – indicating failing cells.
Step-by-Step Voltage Measurement Process
- Prepare the battery: For accurate readings, let lead-acid batteries rest 4+ hours after charging/discharging. Lithium batteries stabilize faster (30-60 minutes).
- Set your multimeter: Select DC voltage mode with range exceeding expected voltage (20V scale for 12V batteries).
- Connect probes properly: Red to positive (+), black to negative (-). Reversed polarity won’t damage modern meters but gives negative readings.
Common mistake: Testing while batteries are charging gives artificially high readings. Always disconnect chargers first.
Interpreting Voltage Readings Correctly
Understanding voltage states is crucial:
| Battery Type | Fully Charged | 50% Discharged | Fully Discharged |
|---|---|---|---|
| 12V Lead-Acid | 12.6-12.8V | 12.2V | 11.9V |
| 3.7V Li-ion | 4.2V | 3.7V | 3.0V |
Pro Tip: For solar systems, measure voltage at dawn (after night discharge) for most accurate state-of-charge assessment.
Troubleshooting Voltage Measurement Issues
When readings don’t match expectations:
- Fluctuating values often indicate poor probe contact – clean terminals with baking soda/water solution
- Sudden voltage drops during testing suggest high internal resistance (common in old batteries)
- Consistently low readings may mean you’re testing under load without realizing it (check for parasitic drains)
Real-world case: A boat owner measured 12.1V on marine batteries, but after cleaning corroded connections, readings jumped to 12.6V – revealing the true state of charge.
Advanced Techniques: Surface Charge and Voltage Compensation
For professional-grade assessments:
- Remove surface charge by applying a 15-30 second load (headlights for cars, 10W resistor for small batteries)
- Compensate for temperature: Add 0.004V per °C below 25°C (77°F) for lead-acid batteries
- For lithium batteries, measure voltage after 5% discharge for most accurate state-of-charge readings
Example: At -10°C (14°F), a “12.0V” reading on a car battery actually equates to ~12.15V at standard temperature – potentially the difference between replacing or keeping the battery.
Battery Voltage Behavior Across Different Chemistries
Discharge Curves: The Voltage Timeline
Each battery chemistry has a unique voltage discharge profile that reveals critical performance characteristics. These curves show how voltage changes as capacity depletes, with significant implications for device operation and battery management:
| Chemistry | Voltage Profile Shape | Critical Voltage Points | Practical Implications |
|---|---|---|---|
| Lead-Acid | Steady decline | 12.6V (full) → 10.8V (cutoff) | Linear voltage drop allows simple charge estimation |
| Li-ion | Flat plateau then steep drop | 4.2V (full) → 3.0V (cutoff) | 80% of capacity occurs between 3.7V-3.9V |
| NiMH | Gradual slope with voltage dip | 1.4V (full) → 1.0V (cutoff) | Voltage dip indicates full discharge approaching |
Voltage Recovery Phenomena and What They Reveal
Batteries exhibit voltage rebound effects that provide diagnostic insights:
- Surface charge dissipation: Immediate 0.2-0.5V drop when load removed (normal in healthy batteries)
- Deep discharge recovery: Lead-acid batteries below 11V may temporarily rebound to 12V after resting – a false indicator of health
- Memory effect voltage: NiCd batteries develop stepped voltage plateaus after partial cycling
Example: A drone LiPo showing 3.2V under load that rebounds to 3.7V after 30 minutes indicates better health than one rebounding only to 3.4V.
Advanced Voltage Analysis Techniques
Professional battery analysts use these methodologies:
- dV/dt analysis: Monitoring voltage change rate during discharge reveals internal resistance changes
- Open Circuit Voltage (OCV) profiling: Correlating rested voltage to state-of-charge requires chemistry-specific lookup tables
- Pulse load testing: Applying controlled current pulses reveals voltage sag characteristics
Case Study: Solar installers use 72-hour OCV profiling to accurately assess lead-acid battery banks, as voltage stabilizes slowly in large systems.
Voltage-Temperature Relationships
Temperature dramatically affects voltage readings and requires compensation:
| Chemistry | Temperature Coefficient | Practical Adjustment |
|---|---|---|
| Lead-Acid | -0.004V/°C below 25°C | Add 0.12V at 0°C |
| Li-ion | -0.003V/°C below 20°C | Add 0.09V at -10°C |
| NiMH | -0.005V/°C below 20°C | Add 0.15V at -10°C |
Critical Insight: Cold temperatures reduce available capacity while increasing apparent voltage – explaining why “fully charged” batteries fail in winter.
Voltage Inconsistencies in Battery Packs
Series-connected cells develop voltage imbalances requiring management:
- Lead-acid banks: >0.2V difference between cells indicates sulfation
- Li-ion packs: BMS systems balance cells within 0.02V
- NiMH arrays: Voltage reversal can occur in mismatched packs
Professional Tip: Always measure individual cell voltages in 12V lead-acid batteries – a “12.6V” reading might hide one dead cell at 10.8V and five good cells at 12.9V.
Voltage Management Strategies for Optimal Battery Performance
Smart Charging: Voltage-Based Charge Control
Modern charging systems use voltage thresholds to optimize battery health across different chemistries:
| Chemistry | Bulk Charge Voltage | Float Voltage | Cutoff Threshold |
|---|---|---|---|
| Flooded Lead-Acid | 14.4-14.8V | 13.2-13.5V | 10.5V |
| AGM/Gel | 14.2-14.4V | 13.5-13.8V | 10.8V |
| LiFePO4 | 14.2-14.6V | 13.6-13.8V | 10.0V |
Example: Overcharging AGM batteries above 14.4V causes electrolyte dry-out, while undercharging below 14.0V leads to sulfation – both detectable through voltage monitoring.
Voltage-Based State of Charge (SoC) Estimation
Accurate SoC determination requires chemistry-specific voltage profiles:
- Lead-Acid: Linear correlation (12.6V=100%, 12.2V=50%, 11.9V=0%)
- Li-ion: Flat curve requires coulomb counting for mid-range SoC
- NiMH: Voltage dip indicates full discharge approaching
Professional Tip: For solar systems, combine voltage readings with specific gravity measurements for lead-acid batteries to compensate for temperature and aging effects.
Voltage Thresholds for Battery Protection Systems
Battery Management Systems (BMS) use these critical voltage points:
- Overcharge Protection: 4.25V/cell for Li-ion, 14.8V for 12V lead-acid
- Deep Discharge Protection: 2.8V/cell for Li-ion, 11.5V for 12V systems
- Cell Balancing Threshold: Typically initiates when cells diverge by >0.03V
Case Study: EV manufacturers use 16-point voltage monitoring systems that sample each cell group at 100Hz frequency to prevent dangerous imbalances.
Voltage Compensation for Temperature Extremes
Advanced charging systems adjust voltages based on temperature:
| Temperature Range | Lead-Acid Compensation | Li-ion Compensation |
|---|---|---|
| Below 0°C (32°F) | +0.024V/°C | Charging prohibited |
| 0-25°C (32-77°F) | +0.012V/°C | +0.003V/°C |
| Above 25°C (77°F) | -0.006V/°C | -0.005V/°C |
Critical Insight: Lithium batteries below freezing require pre-heating before charging – voltage monitoring alone cannot prevent cold-weather damage.
Voltage Ripple Analysis for System Diagnostics
AC voltage components reveal charging system issues:
- Acceptable Ripple: <50mV for lead-acid, <20mV for Li-ion
- Diagnostic Patterns: 120Hz ripple indicates diode issues, random spikes suggest connection problems
- Measurement Method: Use AC-coupled oscilloscope or true-RMS meter set to AC mV range
Example: A marine battery bank showing 200mV ripple was traced to a failing alternator diode – detected before voltage drop became apparent in DC measurements.
Long-Term Voltage Maintenance and Battery Preservation Strategies
Voltage-Based Battery Aging Indicators
Monitoring voltage patterns over time reveals critical aging characteristics:
| Aging Symptom | Voltage Manifestation | Diagnostic Threshold |
|---|---|---|
| Sulfation (Lead-Acid) | Higher resting voltage but rapid drop under load | >0.5V difference between OCV and loaded voltage |
| Lithium Plating (Li-ion) | Faster voltage drop during discharge cycles | 20% increase in dV/dt at same load |
| Memory Effect (NiCd) | Stepped voltage plateaus during discharge | Multiple >0.1V drops in single cycle |
Example: A 3-year-old AGM battery showing 12.8V at rest but dropping to 11.2V under 50% load indicates severe sulfation, requiring immediate reconditioning or replacement.
Optimal Storage Voltage Ranges
Proper storage voltages significantly impact battery lifespan:
- Lead-Acid: Maintain at 12.6-12.8V (full charge) for short-term, 12.4V for long-term (6+ months)
- Li-ion: Store at 3.7-3.8V/cell (40-60% charge) to minimize electrolyte degradation
- NiMH: Store fully charged at 1.4V/cell with monthly top-ups
Critical Insight: Storing lithium batteries at full charge (4.2V) for 12 months can permanently reduce capacity by 20-30%, while proper storage preserves 95% capacity.
Voltage Monitoring Systems for Different Applications
Advanced monitoring solutions vary by use case:
- Automotive: Smart battery sensors tracking voltage, temperature, and current (sampling at 10Hz)
- Solar Storage: Multi-channel loggers recording voltage trends over 24-hour cycles
- Industrial UPS: Predictive analytics systems correlating voltage patterns with failure probabilities
Professional Tip: For off-grid systems, implement voltage-triggered alarms at these thresholds: 11.5V (lead-acid discharge), 14.8V (overcharge), and >0.3V imbalance between cells.
Cost-Benefit Analysis of Voltage Maintenance
| Maintenance Practice | Initial Cost | Lifespan Extension | ROI Period |
|---|---|---|---|
| Smart Chargers | $50-300 | 2-3 years | 6-12 months |
| Voltage Monitoring Systems | $100-500 | 1-2 years | 18-24 months |
| Equalization Charging | $0 (built-in) | 6-12 months | Immediate |
Example: A $200 marine battery monitor preventing one premature $300 battery replacement pays for itself while providing ongoing protection.
Emerging Voltage Management Technologies
Future developments are transforming voltage monitoring:
- AI-Powered Predictive Analysis: Machine learning models forecasting failures from micro-voltage fluctuations
- Quantum Voltage Sensors: Nanoscale devices detecting cell-level anomalies with 0.001V precision
- Self-Balancing Architectures: Modular battery systems automatically compensating for voltage drift
Industry Trend: The new IEEE 1818 standard introduces dynamic voltage thresholds that automatically adjust based on usage patterns and environmental conditions.
Advanced Voltage Optimization for Specialized Applications
Precision Voltage Tuning for Critical Systems
Mission-critical applications require exact voltage control beyond standard ranges:
| Application | Optimal Voltage Range | Tolerance | Control Method |
|---|---|---|---|
| Medical Equipment | 12.65V ±0.05V | 0.4% | Active voltage regulation with backup supercapacitors |
| Aerospace Systems | 28.5V ±0.15V | 0.5% | Triple-redundant monitoring with auto-switching |
| Data Center UPS | 54.0V ±0.25V | 0.46% | Distributed voltage sensing with 10ms response |
Example: Aircraft avionics use 28V nominal systems but maintain 28.5V ±0.1V during flight – deviations beyond this trigger automatic failover procedures.
Voltage Ramp Sequencing for Complex Systems
Multi-battery installations require precise voltage sequencing:
- Parallel Connection Protocol: Match voltages within 0.1V before connecting to prevent current surges
- Series Activation Sequence: Ramp individual cell voltages to within 0.02V before series connection
- Load Sharing Adjustment: Fine-tune parallel strings to ±0.5% voltage matching for balanced current distribution
Case Study: A 1MW solar storage facility reduced battery degradation by 23% after implementing millivolt-level voltage matching across its 420 parallel strings.
Voltage Compensation for Extreme Environments
Special conditions demand adaptive voltage strategies:
- High Altitude: +0.003V per 1,000ft elevation for corona discharge prevention
- Subsea Applications: -0.005V per 100m depth to compensate for pressure effects
- Space Systems: 0.1V higher in vacuum to overcome plasma sheathing effects
Professional Tip: Arctic research stations use heated voltage references to maintain measurement accuracy below -40°C, where standard meters drift by up to 2%.
Voltage Noise Analysis for Predictive Maintenance
Advanced diagnostics use voltage signature analysis:
| Noise Frequency | Amplitude Threshold | Probable Cause |
|---|---|---|
| 50-60Hz | >15mV RMS | Ground loop issues |
| 1-10kHz | >8mV p-p | Switching regulator failure |
| Random spikes | >25mV | Connection corrosion |
Example: A submarine battery bank’s 8mV 120Hz ripple revealed failing intercell connectors six months before traditional voltage tests showed abnormalities.
Voltage Synchronization in Hybrid Systems
Integrating different chemistries requires voltage mediation:
- Lead-Acid + Li-ion: Use DC-DC converters to match 12.8V lead-acid float to 13.6V lithium working voltage
- Supercapacitor Buffering: Maintain 0.1V difference between capacitor bank and battery voltage for optimal energy transfer
- Fuel Cell Integration: Match battery voltage within 2% of fuel cell output voltage for efficient coupling
Emerging Solution: New adaptive bus voltage controllers automatically adjust to ±0.25% across hybrid systems with response times under 50μs.
System-Wide Voltage Management and Lifetime Optimization
Comprehensive Voltage Profiling for Battery Health Assessment
Advanced voltage analysis techniques provide complete battery health diagnostics:
| Test Type | Voltage Parameters Measured | Diagnostic Value | Acceptance Criteria |
|---|---|---|---|
| Static OCV Test | Resting voltage after 24h stabilization | State of charge accuracy | ±0.5% of expected OCV |
| Dynamic Load Test | Voltage drop under 50% C-rate load | Internal resistance | <5% drop from nominal |
| Recovery Test | Voltage rebound after load removal | Electrolyte condition | 90% recovery in <30s |
Example: A telecom backup battery bank passing all three tests with <3% deviation showed 92% remaining capacity after 5 years, extending its service life by 18 months.
Voltage-Based Predictive Maintenance Framework
Implement a four-stage voltage monitoring protocol for maximum system reliability:
- Continuous Monitoring: Track voltage trends with 0.1% accuracy sensors
- Pattern Recognition: Identify micro-fluctuations indicating early degradation
- Threshold Alerts: Set multi-level warnings (advisory/critical/immediate)
- Corrective Protocols: Automated equalization or manual intervention
Case Study: A wind farm reduced battery replacements by 40% after implementing this framework, catching cell imbalances before they caused cascading failures.
Advanced Voltage Balancing Techniques
Modern balancing systems use these voltage control methods:
- Active Balancing: Transfers energy between cells maintaining ±0.005V difference
- Adaptive Charging: Adjusts charge voltage per cell based on historical data
- Dynamic Load Sharing: Routes current to maintain <0.1V pack differential
Professional Insight: Data centers now use AI-driven balancing that predicts voltage drift patterns 72 hours in advance, maintaining <0.3% voltage variation across 10,000+ cell installations.
Voltage Quality Assurance Protocols
Implement these validation procedures for mission-critical systems:
| Test | Procedure | Validation Standard |
|---|---|---|
| 72-Hour Stability | Monitor voltage drift at constant temperature | <0.2% variation |
| Thermal Cycling | Measure voltage response from -20°C to +60°C | Linear coefficient ±5% of spec |
| Transient Response | Apply 100A pulses measuring recovery | 90% recovery in <100ms |
Example: Electric vehicle manufacturers perform 1,000+ voltage validation checks on each battery pack, including 500 thermal cycles and 10,000 simulated drive cycles.
Lifetime Extension Through Voltage Optimization
Proven strategies to maximize battery lifespan:
- Partial State of Charge: Maintain Li-ion at 3.7-3.9V (40-70% SoC) when possible
- Seasonal Voltage Adjustment: Reduce float voltage by 0.1V in summer for lead-acid
- Micro-Cycling: Small 0.2V fluctuations prevent electrolyte stratification
Industry Data: Proper voltage management extends lithium battery calendar life from 8 to 12 years and cycle life from 2,000 to 3,500 cycles in grid storage applications.
Conclusion: Mastering Battery Voltage for Optimal Performance
Understanding battery voltage is fundamental to maximizing performance, safety, and lifespan across all applications. From interpreting discharge curves to implementing advanced monitoring systems, we’ve explored how voltage values reveal critical information about battery health and compatibility.
The comprehensive voltage charts, measurement techniques, and maintenance strategies provided in this guide empower you to make informed decisions whether you’re maintaining car batteries, designing solar systems, or powering portable electronics.
Key takeaways include:
- Different battery chemistries require specific voltage thresholds
- Proper measurement techniques are essential for accurate diagnostics
- Advanced voltage management can significantly extend battery life
Put this knowledge into practice today by regularly monitoring your batteries’ voltage and implementing the appropriate charging and maintenance protocols.
Frequently Asked Questions About Battery Voltage
What exactly does battery voltage indicate?
Battery voltage represents the electrical potential difference between positive and negative terminals, essentially showing how much “pressure” pushes electrons through a circuit. It’s a direct indicator of state of charge and overall health.
For example, a 12V lead-acid battery at 12.6V is fully charged, while at 12.0V it’s only about 25% charged. Voltage also reveals internal resistance – a battery showing normal voltage at rest but significant drop under load likely has aging cells.
How often should I check my battery’s voltage?
For critical systems (cars, solar storage), check voltage monthly. For household batteries, check every 3-6 months. More frequent checks (weekly) are recommended for:
- Batteries over 3 years old
- Extreme temperature environments
- High-drain applications like RVs or medical equipment
Always check after deep discharges or before important use. Use a quality digital multimeter for accurate readings.
Why does my battery show different voltages at different times?
Voltage fluctuates due to several factors:
- State of charge: Drops as battery discharges
- Temperature: Colder temps show lower voltage readings
- Surface charge: Immediately after charging shows artificially high voltage
- Load conditions: Voltage drops when powering devices
For accurate assessment, measure voltage after the battery rests 4+ hours (lead-acid) or 30+ minutes (lithium).
Can I mix batteries with slightly different voltages?
Never mix batteries with more than 0.1V difference in the same circuit. Even small voltage differences cause:
- Current flow between batteries (potentially dangerous)
- Uneven charging/discharging
- Reduced overall performance
In series connections, the difference should be under 0.02V per cell. For example, when connecting two 12V batteries in series, their voltages should match within 0.1V.
How does voltage relate to battery lifespan?
Operating outside ideal voltage ranges dramatically shortens battery life:
- Lead-acid kept below 12.4V develops sulfation
- Lithium-ion stored at 4.2V (full charge) degrades faster
- Overcharging beyond recommended voltage causes electrolyte breakdown
For maximum lifespan, maintain lead-acid between 12.4-12.8V when stored, and lithium-ion between 3.3-3.9V per cell (40-80% charge).
What voltage is too low for a 12V car battery?
Critical thresholds for 12V lead-acid batteries:
- 12.6V+: Fully charged
- 12.4V: 75% charged (minimum for reliable starting)
- 12.0V: 25% charged (risk of damage)
- 11.9V: Fully discharged (immediate recharge needed)
Below 11.9V, permanent sulfation damage occurs. At 10.8V, most vehicles won’t start and battery may be unrecoverable.
Why do lithium battery voltages differ from lead-acid?
Lithium batteries have:
- Higher nominal voltage (3.7V vs 2V per cell)
- Different charge/discharge curve (flat vs sloping)
- Tighter voltage tolerances (±0.05V vs ±0.2V)
- Different full charge voltages (4.2V vs 2.4V per cell)
This is due to their different chemistry – lithium’s higher energy density allows more stable voltage output until nearly discharged.
How accurate are battery voltage indicators on devices?
Built-in indicators vary in accuracy:
- Basic indicators: Often ±0.3V (unreliable for critical decisions)
- Smart devices: Typically ±0.1V with calibration
- Professional equipment: ±0.01V or better
For important measurements, always verify with a quality multimeter. Note that some devices show “calculated” voltage based on usage patterns rather than real-time measurement.