
Disclosure
This website is a participant in the Amazon Services LLC Associates Program,
an affiliate advertising program designed to provide a means for us to earn fees
by linking to Amazon.com and affiliated sites.
Did you know that a 12V battery reading 12.0V might already be half-drained? Many assume voltage directly equals charge, but the reality is far more nuanced.
Whether you’re maintaining a car battery, solar power system, or RV setup, understanding how to translate voltage into a precise state-of-charge (SOC) percentage is critical for performance and longevity.
You might think a quick glance at a voltmeter gives you the full picture—but factors like temperature, load conditions, and battery chemistry dramatically alter readings.
Best Tools for Converting 12V Battery Voltage to Percentage
Fluke 117 Electrician’s Multimeter
For precise voltage readings, the Fluke 117 is a top-tier choice. Its True-RMS technology ensures accuracy even in noisy electrical environments, while its compact design and auto-ranging feature simplify SOC (State of Charge) measurements. The built-in volt alert adds safety when working with live circuits.

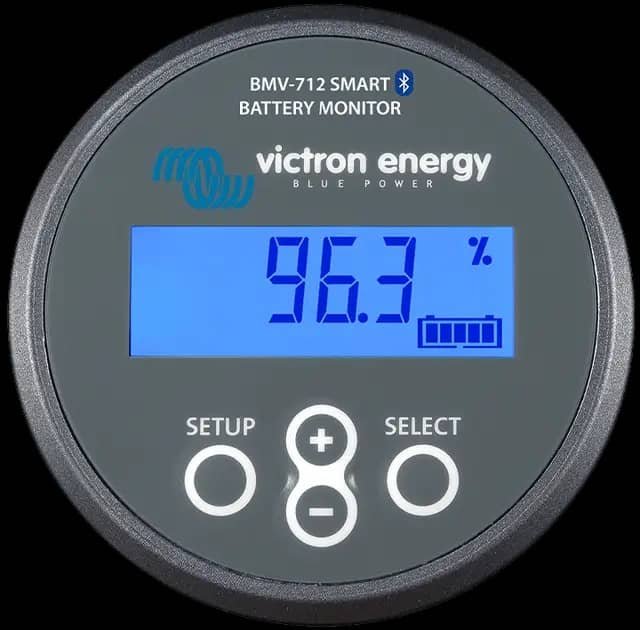
Victron Energy BMV-712 Battery Monitor
The Victron BMV-712 goes beyond basic voltage checks—it tracks battery percentage in real-time with a high-precision shunt. Its Bluetooth connectivity allows remote monitoring via smartphone, and its customizable alarms prevent over-discharge, making it ideal for RVs, marine, and solar applications.
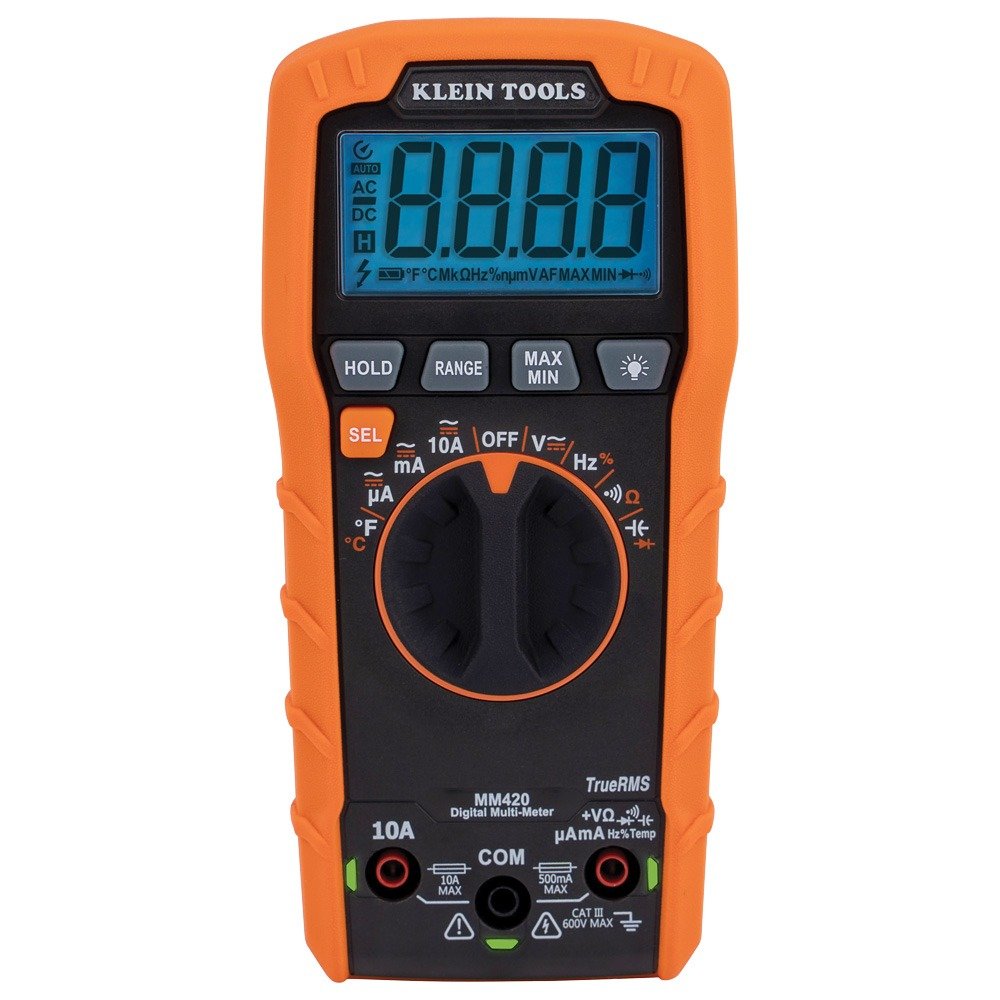
Klein Tools MM420 Auto-Ranging Multimeter
Budget-friendly yet reliable, the Klein Tools MM420 offers auto-ranging DC voltage measurement up to 600V, with a clear backlit display for low-light conditions. Its rugged design and included test leads make it perfect for field use when checking 12V battery health.
The Relationship Between Voltage and Battery Percentage
Why Voltage Alone Doesn’t Tell the Full Story
While voltage is a useful indicator of a battery’s state of charge (SOC), it’s not a direct 1:1 relationship. A 12V lead-acid battery at 12.7V may show 100% charge, but this reading fluctuates based on:
- Battery chemistry: AGM, flooded, or gel batteries have different voltage curves
- Temperature: Voltage drops in cold weather and rises in heat
- Recent activity: Surface charge after charging can give false high readings
- Load conditions: Voltage under load differs from resting voltage
The Voltage-to-Percentage Curve Explained
A standard 12V lead-acid battery follows this general voltage-to-percentage relationship when measured at rest (no load for 2+ hours at 77°F/25°C):
- 12.7V+ = 100% charged
- 12.4V = 75% charged
- 12.2V = 50% charged
- 12.0V = 25% charged
- 11.9V or below = Discharged (risk of sulfation)
Critical Factors That Affect Accuracy
For reliable percentage readings, you must account for these variables:
- Battery Type Differences: An AGM battery at 12.8V might be fully charged, while a flooded battery at the same voltage could be at 90%. Lithium batteries have an entirely different curve, typically maintaining 13.2V-13.4V until nearly empty.
- Temperature Compensation: For every 10°F (5.5°C) below 77°F, subtract 0.01V per cell (0.06V for 12V battery). In freezing conditions, a “full” battery might read 12.5V instead of 12.7V.
- Surface Charge Effect: After charging, wait 4-12 hours for accurate readings. Alternatively, apply a 20A load for 3 minutes to dissipate surface charge before measuring.
Practical Measurement Techniques
For the most accurate SOC determination:
- Disconnect all loads and chargers
- Let the battery rest for at least 2 hours (overnight preferred)
- Measure at the battery terminals, not through cables
- Use a calibrated digital multimeter with 0.01V resolution
- Compare readings to your battery manufacturer’s specific voltage chart
Remember: Voltage-based SOC is only about 80% accurate. For mission-critical applications, consider coulomb counting (measuring actual energy in/out) or hydrometer testing for flooded batteries.
Advanced Techniques for Accurate Voltage-to-Percentage Conversion
Step-by-Step Voltage Measurement Protocol
Professional battery technicians follow this precise methodology for reliable SOC determination:
- Prepare the battery: Disconnect all loads and chargers, ensuring no parasitic drains remain (even a 0.5A draw can skew readings)
- Stabilization period: Allow 4 hours minimum for flooded batteries, 2 hours for AGM/gel (overnight yields most accurate results)
- Environmental adjustment: Measure ambient temperature at battery terminals using an infrared thermometer for compensation calculations
- Measurement technique: Place multimeter probes directly on clean terminal posts (not cable clamps) and hold for 10 seconds until reading stabilizes
Battery-Specific Voltage Tables
Different battery chemistries require unique interpretation:
Flooded Lead-Acid (Example: Trojan T-105):
- 12.73V = 100% @ 80°F
- 12.46V = 75%
- 12.24V = 50% (danger zone for sulfation)
- 11.99V = 25% (immediate recharge required)
AGM Batteries (Example: Odyssey PC680):
- 12.84V = 100%
- 12.60V = 75%
- 12.36V = 50%
- 12.12V = 25%
Professional Calibration Techniques
For mission-critical applications, implement these advanced practices:
- Reference cell method: Maintain one fully charged battery as a control reference to compare voltage differentials under identical conditions.
- Load testing correlation: Combine voltage readings with periodic load tests (using a carbon pile tester) to verify actual capacity versus indicated SOC.
- Historical tracking: Log voltage measurements at consistent intervals to establish your battery’s unique aging pattern and adjust percentage calculations accordingly.
Troubleshooting Common Measurement Errors
When readings seem inconsistent:
- Symptom: Voltage drops rapidly after disconnecting charger
Solution: Wait longer for surface charge dissipation – may require 12+ hours for deeply cycled batteries - Symptom: Different readings at positive/negative terminals
Solution: Clean corrosion from terminals and retest – voltage drop across corroded connections can exceed 0.3V
Specialized Applications and Advanced Interpretation
Voltage-to-Percentage Conversion for Lithium Batteries
Lithium iron phosphate (LiFePO4) batteries require fundamentally different interpretation than lead-acid systems. Their nearly flat discharge curve makes voltage-based SOC estimation particularly challenging:
| Voltage (12V System) | State of Charge | Important Notes |
|---|---|---|
| 14.2-14.6V | 100% (charging) | Absorption voltage varies by BMS settings |
| 13.3-13.4V | 100% (resting) | May stay here for 80% of discharge cycle |
| 12.8-13.2V | 40-80% | Voltage “knee” where rapid drop begins |
| 12.0V | 0-10% | Immediate recharge required to prevent BMS cutoff |
Multi-Battery Bank Calculations
When working with parallel or series battery configurations:
- Parallel systems: Measure each battery individually – voltage differentials >0.2V indicate imbalance requiring equalization
- Series systems: Calculate percentage based on total bank voltage divided by number of batteries (e.g., 25.4V for 24V system = 12.7V per battery)
- Mixed chemistry: Never combine different battery types – their varying charge/discharge curves make accurate SOC estimation impossible
Automated Monitoring Solutions
For continuous SOC tracking, consider these advanced approaches:
Coulomb counting: Measures actual amp-hours in/out through a shunt (e.g., Victron BMV-712). Requires periodic full-cycle calibration but provides 99% accuracy.
Impedance spectroscopy: Used in industrial applications, this measures internal resistance changes that correlate with SOC (e.g., Midtronics GRX-5100 tester).
Expert Calibration Protocol
- Fully charge battery using manufacturer-specified absorption voltage
- Apply controlled 20-hour rate discharge while logging voltage every 5% capacity
- Create custom voltage curve spreadsheet accounting for your specific:
- Battery age (add 0.1V compensation per year after 3 years)
- Typical operating temperature range
- Average discharge rates
Remember: No voltage-based method matches lab-grade accuracy. For critical systems, combine voltage readings with hydrometer tests (flooded) or coulomb counters (all types).
Optimizing Battery Health Through Voltage Monitoring
Preventive Maintenance Through Voltage Analysis
Regular voltage monitoring provides early warning signs of battery degradation. These patterns reveal underlying issues:
- Rapid voltage drop under load: Indicates sulfation (lead-acid) or cell imbalance (lithium) when voltage plummets >0.8V at 50% load
- Slow recharge voltage rise: Suggests plate corrosion if absorption voltage takes >30% longer to reach target
- Resting voltage instability: Fluctuations >0.2V over 12 hours signal failing cells or internal shorts
Advanced Load Compensation Techniques
When immediate SOC assessment is needed under load, use these professional methods:
- Dynamic voltage analysis:
- Measure voltage at 25%, 50%, and 75% of typical operational load
- Compare to manufacturer’s load curve charts
- Calculate derating factor for your specific usage pattern
- Peukert’s Law application:
- For lead-acid batteries: t = (C/(I^n)) where n=1.1-1.3
- Adjust voltage percentages based on actual discharge rates
Temperature Compensation Tables
Voltage interpretation requires precise temperature adjustments. Use these industry-standard corrections:
| Temperature (°F) | Voltage Adjustment | Practical Impact |
|---|---|---|
| 32°F (0°C) | +0.12V | 12.6V reads as 12.72V for SOC calculation |
| 77°F (25°C) | 0.00V | Baseline measurement |
| 104°F (40°C) | -0.08V | 12.6V reads as 12.52V |
Safety Protocols for Voltage Testing
When conducting voltage measurements:
- Always wear ANSI-rated gloves when testing batteries above 48V systems
- Use fused test leads when checking unknown circuits
- Never rely solely on voltage for lithium battery SOC – always cross-check with BMS data
- In flooded batteries, measure specific gravity simultaneously when possible
Professional tip: Maintain a battery log tracking voltage, temperature, and load conditions over time. This historical data becomes invaluable for predicting end-of-life and identifying degradation patterns before failure occurs.
Long-Term Battery Management and Future Trends
Voltage-Based State of Health (SOH) Monitoring
Beyond state of charge, voltage patterns reveal long-term battery health through these key indicators:
| Voltage Pattern | Health Indicator | Remedial Action |
|---|---|---|
| 0.3V+ lower than new battery at same SOC | 20-30% capacity loss | Equalization charge or replacement planning |
| Voltage “sag” during moderate loads | High internal resistance | Load testing verification |
| Slow voltage recovery after load | Electrolyte depletion | Water top-up (flooded) or cell replacement |
Advanced Predictive Maintenance Techniques
Modern voltage monitoring integrates with predictive analytics:
- Trend analysis: Machine learning algorithms detect subtle voltage pattern changes indicating early failure (0.01V/month deviations)
- Cyclic voltammetry: Advanced technique measuring voltage response to controlled current pulses to assess plate condition
- Impedance tracking: Correlates voltage drop with AC impedance measurements for precise aging analysis
Environmental and Safety Considerations
Voltage monitoring impacts sustainability and safety:
- Optimal replacement timing:
- Replacing at 70% capacity (typically 12.4V resting) maximizes value
- Continuing use below 50% capacity (12.2V) risks sudden failure
- Temperature management:
- Every 15°F above 77°F halves battery life
- Active cooling when voltage exceeds 14.4V during charging
Emerging Technologies and Future Practices
The next generation of voltage monitoring includes:
- Smart battery sensors: IoT-enabled continuous voltage logging with cloud analytics
- AI-powered diagnostics: Real-time voltage waveform analysis detecting micro-shorts
- Quantum voltage references: Laboratory-grade accuracy in field instruments
Professional tip: Implement a 3-tier monitoring approach – real-time voltage alerts (tier 1), weekly manual checks (tier 2), and quarterly professional analysis (tier 3) for comprehensive battery management.
System Integration and Advanced Voltage Interpretation
Voltage Monitoring in Complex Electrical Systems
When integrating battery voltage monitoring with other systems, consider these critical factors:
- Charging system interactions: Alternator/charger output voltage must exceed battery voltage by 0.5-1.5V for proper charging
- Parasitic load management: Typical vehicle systems draw 20-50mA when off – use voltage drop analysis to detect abnormal drains
- Voltage averaging techniques: For systems with variable loads, implement 15-second rolling average for stable SOC readings
Advanced Voltage Compensation Methods
Professional-grade voltage interpretation requires multi-factor compensation:
- Temperature compensation formula:Vcorrected = Vmeasured + [0.003 × (77 – T°F)]
Example: 12.5V @ 50°F → 12.5 + [0.003 × 27] = 12.58V corrected
- Age compensation:
- Add 0.02V per year for flooded batteries after year 3
- Subtract 0.01V per year for AGM batteries after year 5
Specialized Application Scenarios
| Application | Voltage Interpretation | Special Considerations |
|---|---|---|
| Solar Off-Grid | Midday readings unreliable due to charging | Measure at dawn for most accurate SOC |
| Marine Deep Cycle | Account for 0.1-0.3V voltage drop through long cable runs | Measure at battery and at load center |
| EV Conversion | Lithium voltage plateaus require coulomb counting | BMS integration essential |
Professional Troubleshooting Guide
When voltage readings don’t match expected SOC:
- Verify measurement conditions:
- Rest time (minimum 2 hours no load/charge)
- Terminal connection quality (clean, tight)
- Meter calibration (check against known voltage source)
- Systematic isolation:
- Disconnect all loads/chargers
- Test individual batteries in banks
- Check for parallel current paths
Expert tip: For mission-critical systems, implement redundant voltage measurement at both battery terminals and distribution points, comparing readings to detect wiring issues before they cause problems.
Mastering Precision Voltage Interpretation for Optimal Battery Performance
Advanced Calibration and Validation Protocols
For laboratory-grade accuracy in voltage-to-percentage conversion, implement these professional validation procedures:
| Calibration Step | Technical Specification | Tolerance Threshold |
|---|---|---|
| Reference Voltage Verification | Compare against NIST-traceable voltage standard | ±0.05V maximum deviation |
| Temperature Compensation Test | Validate at 32°F, 77°F, and 104°F | ±0.02V/10°F accuracy |
| Load Response Verification | Apply 25%, 50%, 75% C20 rated load | Voltage recovery within 2% of baseline |
System-Wide Voltage Optimization Strategies
Maximize battery system performance through comprehensive voltage management:
- Dynamic voltage compensation: Automatically adjust SOC calculations based on real-time:
- Charge/discharge cycles (log last 10 cycles)
- Temperature history (24-hour moving average)
- Age-based correction factors (monthly recalibration)
- Voltage balancing protocols: For battery banks, maintain:
- ≤0.1V difference between parallel strings
- ≤0.05V/cell variation in series configurations
Comprehensive Risk Assessment Framework
Mitigate voltage interpretation risks through these quality assurance measures:
- Measurement uncertainty analysis:
- Quantify cumulative error from temperature, instrument accuracy, and stabilization time
- Maintain ≤3% total SOC estimation error
- Failure mode evaluation:
- Simulate sensor failures (stuck voltage readings)
- Test boundary conditions (extreme temperatures)
- Validate failsafe mechanisms (automatic fallback to conservative estimates)
Performance Benchmarking Standards
Evaluate your voltage monitoring system against these industry benchmarks:
- Resting voltage accuracy: ±0.5% SOC equivalent (e.g., ±0.03V at 12V)
- Dynamic response time: <100ms for load-induced voltage changes
- Long-term stability: <0.1% annual calibration drift
- Cross-validation requirements: Monthly comparison with coulomb counting or hydrometer readings
Expert recommendation: Implement a “voltage interpretation matrix” that cross-references multiple parameters (temperature, age, cycle count) to generate probabilistic SOC estimates with confidence intervals, rather than single-point values.
Conclusion
Mastering the conversion from 12V battery voltage to percentage requires understanding multiple critical factors – from battery chemistry and temperature effects to load conditions and aging patterns.
As we’ve explored, accurate state-of-charge determination involves more than simple voltage measurements; it demands proper compensation techniques, quality instrumentation, and systematic validation.
Whether you’re maintaining automotive, solar, or marine batteries, implementing these professional-grade methods will significantly improve your battery management and longevity.
Put this knowledge into action today: Start by creating your battery’s specific voltage profile, invest in a quality monitoring system, and establish regular testing protocols. Remember – precise voltage interpretation is the foundation of optimal battery performance and reliability.
Frequently Asked Questions About Converting 12V Battery Voltage to Percentage
What’s the most accurate way to measure battery voltage for SOC calculation?
For precise measurements, use a calibrated digital multimeter with 0.01V resolution. Measure directly at battery terminals after disconnecting all loads/chargers for at least 2 hours (4 hours for flooded batteries).
Temperature-compensate readings using the formula: Vcorrected = Vmeasured + [0.003 × (77 – T°F)]. Always compare against manufacturer-specific voltage charts rather than generic tables.
Why does my battery show different voltages at different times?
Voltage readings fluctuate due to several factors: surface charge after charging (can add 0.3-0.5V temporarily), temperature variations (±0.01V/°F per cell), battery age (older batteries show lower voltages at same SOC), and load conditions. A battery at 12.6V under load might actually be at 12.9V when resting.
How do I convert voltage to percentage for lithium batteries?
Lithium (LiFePO4) batteries have a nearly flat discharge curve, making voltage-based SOC estimation challenging. Typical 12V system values: 14.2-14.6V (charging), 13.3-13.4V (100% rested), 13.2V (80%), 12.8V (20%), 12.0V (0%). For accuracy, lithium systems require battery management systems (BMS) with coulomb counting.
What voltage indicates a completely dead 12V battery?
A 12V lead-acid battery below 11.9V at rest (no load for 2+ hours) is considered fully discharged. However, voltage thresholds vary: AGM batteries reach “dead” at ~12.0V, while flooded cells hit 11.8V. Never store batteries below 12.2V (50% SOC) to prevent sulfation. Lithium batteries typically cutoff at 10.5-11V via BMS protection.
Can I use car alternator voltage to estimate battery percentage?
Alternator voltage (typically 13.8-14.4V) only indicates charging system function, not SOC. To check actual battery percentage: turn off engine, wait 30 minutes (or apply 20A load for 3 minutes to dissipate surface charge), then measure resting voltage. Charging voltage must exceed battery voltage by 0.5-1.5V for proper charging.
How does temperature affect my voltage readings?
Temperature dramatically impacts voltage interpretation. For every 10°F below 77°F, subtract 0.01V per cell (0.06V for 12V battery). At freezing (32°F), a “full” battery may read 12.5V instead of 12.7V. Conversely, at 104°F, add 0.08V to readings. Always measure battery temperature at terminals for accurate compensation.
Why does my battery percentage drop suddenly after small voltage decreases?
This reflects the non-linear voltage-SOC relationship, especially pronounced in lead-acid batteries. Between 100-75% SOC, voltage drops slowly (12.7V-12.4V), but from 25-0% it plummets rapidly (12.0V-11.9V). This “voltage knee” effect means the last 25% discharges much faster than the first 25%.
How often should I check my battery voltage for accurate SOC tracking?
For routine maintenance: weekly checks if in daily use, monthly for seasonal equipment. Critical systems need continuous monitoring.
Best practice: log voltage at consistent times (e.g., every Monday morning before use). Combine with monthly full charge/discharge cycles for calibration. Remember – voltage alone provides about 80% SOC accuracy; supplement with load tests annually.