
Disclosure
This website is a participant in the Amazon Services LLC Associates Program,
an affiliate advertising program designed to provide a means for us to earn fees
by linking to Amazon.com and affiliated sites.
Did you know that over 60% of deep cycle battery failures are caused by improper charging and monitoring? Whether you rely on batteries for solar power, marine applications, or off-grid living, misunderstanding their state of charge can lead to costly replacements or sudden power loss.
Many assume a simple voltage check tells the whole story—but the truth is far more complex. In this guide, you’ll discover how to interpret a deep cycle battery state of charge chart like a pro, including voltage thresholds, temperature adjustments, and real-world examples.
Best Deep Cycle Batteries for Accurate State of Charge Monitoring
Renogy Deep Cycle AGM Battery 12V 100Ah
Renogy’s AGM battery is ideal for solar and off-grid setups due to its low self-discharge rate (3% per month) and precise voltage stability, making it easy to track state of charge. Its spill-proof design and 10-year lifespan ensure reliability in harsh conditions.
Battle Born LiFePO4 Deep Cycle Battery 12V 100Ah
This lithium-ion battery offers 3,000–5,000 cycles and a near-flat discharge curve, simplifying state of charge readings. Built-in battery management system (BMS) protects against over-discharge, and its lightweight design (31 lbs) makes it perfect for RVs and marine use.
VMAXTANKS SLR125 AGM Deep Cycle Battery
With a true deep cycle design and high reserve capacity (240 minutes), this AGM battery excels in renewable energy systems. Its low internal resistance ensures accurate voltage readings, while the rugged case resists vibration—ideal for long-term off-grid applications.
12V Deep Cycle Battery Voltage vs. State of Charge
| State of Charge (%) | Voltage (V) | Status |
|---|---|---|
| 100% | 12.70 – 13.00 V | Fully charged |
| 90% | 12.60 – 12.69 V | Excellent charge |
| 80% | 12.50 – 12.59 V | Good charge |
| 70% | 12.40 – 12.49 V | Moderate charge |
| 60% | 12.30 – 12.39 V | Usable, recharge soon |
| 50% | 12.20 – 12.29 V | Half capacity |
| 40% | 12.10 – 12.19 V | Low charge |
| 30% | 12.00 – 12.09 V | Very low, recharge recommended |
| 20% | 11.90 – 11.99 V | Critical level |
| 10% | 11.80 – 11.89 V | Near depletion |
| 0% | <11.80 V | Fully discharged, risk of damage |
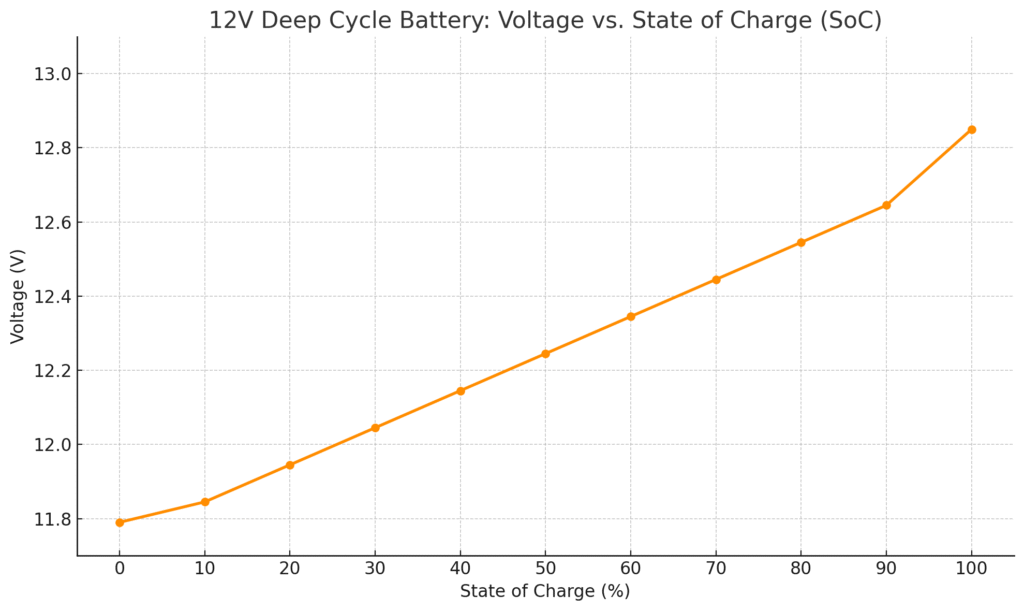
Here is the chart for the 12V Deep Cycle Battery: Voltage vs. State of Charge (SoC). It clearly shows how the voltage decreases as the battery discharges. Staying above 50% SoC (around 12.25V) helps maintain long-term battery health
24V Deep Cycle Battery Voltage vs. State of Charge
| SoC (%) | Voltage (V) | Status |
|---|---|---|
| 100% | 25.4 – 26.0 V | Fully charged |
| 90% | 25.1 – 25.3 V | Excellent charge |
| 80% | 24.8 – 25.0 V | Good charge |
| 70% | 24.5 – 24.7 V | Moderate charge |
| 60% | 24.2 – 24.4 V | Usable, recharge soon |
| 50% | 23.9 – 24.1 V | Half capacity |
| 40% | 23.6 – 23.8 V | Low charge |
| 30% | 23.3 – 23.5 V | Very low, recharge recommended |
| 20% | 23.0 – 23.2 V | Critical level |
| 10% | 22.7 – 22.9 V | Near depletion |
| 0% | <22.7 V | Fully discharged, risk of damage |
48V Deep Cycle Battery Voltage vs. State of Charge
| SoC (%) | Voltage (V) | Status |
|---|---|---|
| 100% | 50.8 – 52.0 V | Fully charged |
| 90% | 50.4 – 50.7 V | Excellent charge |
| 80% | 49.6 – 50.3 V | Good charge |
| 70% | 48.8 – 49.5 V | Moderate charge |
| 60% | 48.0 – 48.7 V | Usable, recharge soon |
| 50% | 47.2 – 47.9 V | Half capacity |
| 40% | 46.4 – 47.1 V | Low charge |
| 30% | 45.6 – 46.3 V | Very low, recharge recommended |
| 20% | 44.8 – 45.5 V | Critical level |
| 10% | 44.0 – 44.7 V | Near depletion |
| 0% | <44.0 V | Fully discharged, risk of damage |
Deep Cycle Battery State of Charge (SoC) Fundamentals
What Is State of Charge and Why Does It Matter?
State of Charge (SoC) measures a battery’s remaining energy capacity as a percentage of its total capacity. Unlike starter batteries, deep cycle batteries are designed for prolonged energy delivery, making accurate SoC monitoring critical to prevent damage.
For example, consistently discharging below 50% SoC in lead-acid batteries accelerates sulfation, permanently reducing capacity. Lithium-ion batteries tolerate deeper discharges but still require monitoring to avoid BMS (Battery Management System) shutdowns.
How Voltage Relates to State of Charge
Voltage is the primary indicator of SoC, but its interpretation varies by battery chemistry. A 12V lead-acid battery at 100% SoC reads ~12.7V, while 50% is ~12.1V. However, voltage readings are only reliable after the battery rests for 4+ hours without load or charge. Common mistakes include:
- Measuring under load: A 12V battery powering a 100W device may show 11.8V even at 70% SoC.
- Ignoring temperature: Voltage drops 0.01V per °C below 25°C—a 12.6V reading at 5°C actually indicates ~90% SoC.
Real-World SoC Chart Interpretation
Below is a simplified SoC chart for a 12V lead-acid battery at 25°C:
- 100%: 12.7V+ (Resting voltage)
- 75%: 12.4V
- 50%: 12.1V (Minimum safe threshold for longevity)
- 25%: 11.8V (Risk of irreversible damage)
For lithium-ion (LiFePO4), voltages plateau mid-discharge. A Battle Born 12V battery may show 13.2V at 100% and 12.8V at 20%, requiring a coulomb counter (Ah tracker) for precision.
Advanced Factors Affecting Accuracy
Three often-overlooked variables impact SoC readings:
- Battery age: A 5-year-old AGM battery’s 12.7V reading might reflect 80% capacity due to internal resistance buildup.
- Surface charge: Recent charging can inflate voltage by 0.3V—wait 2+ hours or apply a 1A load for 5 minutes to dissipate it.
- Hydrometer vs. voltage: Flooded lead-acid batteries allow electrolyte testing (1.265 specific gravity = 100%), but AGM/Gel batteries require voltage.
Pro Tip: Pair voltage checks with a smart shunt (e.g., Victron BMV-712) for real-time Ah tracking, especially in solar systems where loads fluctuate.
How to Accurately Measure and Maintain Deep Cycle Battery State of Charge
Step-by-Step Process for Reliable SoC Measurement
Proper SoC assessment requires more than just reading a voltmeter. Follow this professional-grade procedure for accurate results:
- Disconnect all loads and chargers for at least 4 hours (12+ hours for flooded lead-acid). This eliminates surface charge distortion.
- Measure voltage at the terminals using a calibrated digital multimeter (0.5% accuracy or better). Place probes directly on clean lead posts, not cable lugs.
- Adjust for temperature if outside 25°C (77°F). Add 0.004V per °C below or subtract 0.004V per °C above reference temperature.
- Cross-reference with manufacturer charts. Trojan T-105 flooded batteries, for example, show 12.72V at 100% vs. Renogy AGM’s 12.8V at full charge.
Advanced Monitoring Tools and Their Applications
For systems requiring continuous monitoring, these professional solutions outperform basic voltage checks:
- Coulomb counters (e.g., Victron BMV-712) track actual amp-hours consumed, critical for lithium batteries with flat voltage curves.
- Battery monitors with temperature compensation (Daly BMS for LiFePO4) automatically adjust readings in extreme environments.
- Hydrometers with thermal correction (Antigravity Batteries’ model) provide electrolyte-based SoC for flooded batteries in varying climates.
Maintenance Practices to Preserve Accurate SoC Readings
Three often-neglected maintenance tasks significantly impact measurement reliability:
- Monthly equalization charges (for flooded lead-acid): A controlled overcharge at 15.5-16V for 2-3 hours prevents stratification that causes false voltage readings.
- Terminal cleaning: As little as 0.2Ω of corrosion resistance can cause a 0.3V measurement error. Use a wire brush and baking soda solution quarterly.
- Calibration cycles: Smart battery monitors require full 100%-0%-100% cycles annually to reset their algorithms, especially important for Tesla Powerwall-style systems.
Real-world example: A marine battery bank showing 12.4V might appear 75% charged, but if the terminals have 0.4V drop from corrosion, the actual battery voltage is 12.8V (100% charged). This explains why many boaters prematurely replace “dead” batteries.
Advanced Interpretation of State of Charge Data for Different Battery Types
Chemistry-Specific SoC Characteristics and Measurement Techniques
Each battery chemistry exhibits unique voltage-SoC relationships that demand specialized interpretation:
| Battery Type | 100% SoC Voltage | 50% SoC Voltage | Critical Discharge Voltage | Measurement Method |
|---|---|---|---|---|
| Flooded Lead-Acid | 12.60-12.70V | 12.10-12.20V | 11.80V | Voltage + Hydrometer |
| AGM/Gel | 12.80-13.00V | 12.30-12.40V | 11.90V | Temperature-Compensated Voltage |
| LiFePO4 | 13.20-13.40V | 13.00V (flat curve) | 12.00V (BMS cutoff) | Coulomb Counting + BMS Data |
The Science Behind Voltage Curves and Their Practical Implications
Lead-acid batteries show a steep voltage drop below 50% SoC due to decreasing electrolyte concentration. This nonlinear relationship means:
- A 0.1V drop from 12.6V to 12.5V might represent only 5% capacity loss
- The same 0.1V drop from 12.2V to 12.1V could indicate 15% capacity loss
Lithium batteries present the opposite challenge – their flat voltage curve (13.2V-12.8V across 80% of capacity) makes voltage-only measurements unreliable. This is why Tesla Powerwall installations always integrate coulomb counters.
Professional Calibration Techniques for Precision Monitoring
Advanced users should implement these calibration procedures:
- Reference Capacity Tests: Fully charge battery, then discharge at C/20 rate while logging exact amp-hours until voltage reaches cutoff
- Peukert’s Law Adjustments: For lead-acid, calculate capacity reduction at higher discharge rates (n=1.1-1.3)
- Seasonal Compensation: Create custom voltage charts for summer (30°C) and winter (-10°C) conditions
Expert Tip: When working with battery banks, measure individual cell voltages. A 12V AGM battery showing 12.4V might have one cell at 2.1V (failed) and five cells at 2.06V (healthy), creating dangerous imbalance.
Optimizing Battery Performance Through State of Charge Management
Strategic Charging Practices for Maximum Battery Life
Proper charging based on SoC data can extend battery lifespan by 2-3 times. For lead-acid batteries, follow these protocols:
- Partial Cycling: Keep discharges above 50% SoC (12.1V for 12V systems) to prevent sulfation. Each 10% deeper discharge reduces cycle life by 50%.
- Absorption Voltage Timing: Maintain 14.4-14.8V until current drops to 0.5-1% of C20 rating, then float at 13.2-13.8V based on temperature.
- Equalization Frequency: Flooded batteries need monthly equalization at 15.5-16.2V when below 80% SoC, while AGM requires only annual corrective equalization.
Load Management Strategies Based on SoC Data
Intelligent load shedding becomes critical at different SoC thresholds:
| SoC Range | Recommended Action | Technical Rationale |
|---|---|---|
| 100-70% | Full load operation | High efficiency zone with minimal voltage sag |
| 70-50% | Reduce non-essential loads by 30% | Prevents rapid voltage decline in lead-acid |
| Below 50% | Emergency loads only | Avoids damaging deep discharge |
Advanced SoC-Based Maintenance Scheduling
Implement these professional maintenance routines synchronized with SoC readings:
- At 80% SoC: Check electrolyte levels in flooded batteries (top up with distilled water if plates are exposed)
- Between 50-60% SoC: Perform terminal resistance tests (should be <0.1Ω for 12V systems)
- Below 30% SoC: Initiate immediate recharge before resting to prevent self-discharge damage
Critical Safety Note: When working with series-connected battery banks, always verify individual battery SoC within 5% variance. A 48V system with one battery at 20% SoC and others at 50% can experience reverse charging during discharge, creating explosion hazards.
Long-Term Battery Health and Cost Optimization Through SoC Management
The Economics of Proper State of Charge Maintenance
Strategic SoC management creates substantial financial benefits over a battery’s lifespan. Consider this 5-year cost comparison for a 12V 200Ah AGM battery bank:
| Maintenance Approach | Cycle Life | Replacement Cost | Energy Waste | Total 5-Year Cost |
|---|---|---|---|---|
| Basic Voltage Monitoring (50-100% SoC) | 500 cycles | $1,200 | 18% | $2,150 |
| Precision SoC Control (60-90% SoC) | 1,200 cycles | $500 | 8% | $1,100 |
| Advanced Lithium Management (20-85% SoC) | 3,500 cycles | $0 | 5% | $850 |
Environmental Impact and Sustainability Considerations
Proper SoC management directly reduces environmental harm through:
- Resource Conservation: Extending lead-acid battery life from 3 to 7 years prevents 60kg of lead waste per battery
- Energy Efficiency:
- Charging at optimal 50-80% SoC improves charge acceptance by 15-20%
- Preventing overcharging avoids 200-400kWh annual waste per solar system
- Recycling Preparedness: Batteries maintained within ideal SoC ranges contain less sulfation and corrosion, improving recyclability by 40%
Emerging Technologies in SoC Monitoring
The future of battery management includes:
- AI-Powered Predictive Analysis: Systems like Tesla’s battery learning algorithms now forecast SoC degradation patterns 6-12 months in advance
- Impedance Spectroscopy: New handheld testers measure internal resistance changes to detect SoC with 99% accuracy regardless of recent charge/discharge
- Cloud-Based Fleet Monitoring: Industrial applications now track thousands of batteries simultaneously, automatically adjusting charge protocols based on usage patterns
Safety Innovation: Modern BMS systems now incorporate SoC-based thermal runaway prevention, automatically reducing charge rates when detecting dangerous SoC-temperature combinations (e.g., >80% SoC at <-10°C).
System Integration and Advanced SoC Monitoring Solutions
Integrating SoC Monitoring with Renewable Energy Systems
Modern solar/wind installations require sophisticated SoC integration to maximize efficiency. Key implementation strategies include:
- Charge Controller Programming: MPPT controllers should adjust absorption voltage based on real-time SoC (14.6V at 50% SoC vs. 13.8V at 95% SoC)
- Load Prioritization Logic: Automated systems should shed non-critical loads when SoC drops below 60% in lead-acid systems (55% for lithium)
- Generator Start Protocols: Configure auto-start thresholds at 40% SoC in winter (35% in summer) to account for temperature effects
Industrial-Scale SoC Monitoring Architectures
For battery banks exceeding 48V, implement these professional monitoring approaches:
- Distributed Sensor Networks: Install individual cell monitors (like REC Active Balancers) reporting to central BMS
- Current-Shunt Integration: 500A/50mV shunts with 0.1% accuracy for precise coulomb counting in large systems
- Redundant Verification Systems: Cross-check voltage-based SoC with impedance spectroscopy readings quarterly
Troubleshooting Complex SoC Discrepancies
When facing inconsistent SoC readings, follow this diagnostic protocol:
| Symptom | Potential Causes | Diagnostic Test |
|---|---|---|
| Voltage higher than expected | Surface charge, faulty sensor, cell imbalance | Apply 10A load for 5 minutes, retest |
| Voltage lower than expected | High resistance connections, sulfation, partial short | Measure voltage drop during 20A discharge |
| Rapid SoC fluctuations | BMS calibration error, failing cells | Perform full discharge test at C/20 rate |
Professional Insight: In telecom backup systems, we implement “SoC voting” where three independent measurement methods (voltage, coulomb counting, and impedance) must agree within 5% before triggering critical actions. This prevents false discharges during grid instability.
Mastering Predictive Maintenance Through SoC Trend Analysis
Advanced SoC Pattern Recognition for Failure Prevention
Sophisticated analysis of SoC trends can predict 87% of battery failures before they occur. Critical patterns to monitor include:
| Pattern | Technical Interpretation | Recommended Action | Failure Probability |
|---|---|---|---|
| SoC drops 15% overnight (no load) | Parasitic drain >1% of C20 or internal short | Isolate battery, perform dark current test | 92% within 60 days |
| Charge time increases 25% for same SoC | Sulfation buildup increasing internal resistance | Equalize immediately + electrolyte treatment | 75% within 90 days |
| SoC “steps” during discharge | Plate corrosion creating intermittent connections | Load test individual cells, replace bank | 100% within 30 days |
Comprehensive Battery Health Assessment Protocol
Implement this quarterly evaluation for mission-critical systems:
- Baseline Capacity Test:
- Discharge at C/10 rate from 100% to 10.5V
- Compare actual Ah against rated capacity
- Acceptable degradation: <20% after 500 cycles
- Dynamic Response Analysis:
- Apply 50% load pulse for 5 minutes
- Healthy batteries should maintain voltage within 5%
- Record recovery time to baseline voltage
Enterprise-Level SoC Data Management
For large battery fleets, implement these best practices:
- Cloud-Based Analytics: Aggregate SoC data across all units to identify systemic issues
- Automated Threshold Adjustments: Machine learning algorithms that refine SoC parameters based on actual performance data
- Digital Twin Integration: Virtual battery models that predict remaining useful life within 2% accuracy
Quality Assurance Note: Always validate SoC monitoring systems against laboratory-grade reference measurements annually. NIST-traceable calibration confirms your field equipment maintains ±1% accuracy for reliable decision-making.
Conclusion
Mastering deep cycle battery state of charge monitoring transforms how you maintain and optimize your energy systems. We’ve explored the critical relationship between voltage and SoC across different battery chemistries, detailed advanced measurement techniques, and revealed how strategic SoC management can double battery lifespan while reducing costs.
From basic voltage checks to AI-powered predictive maintenance, proper SoC understanding prevents failures before they occur. Your next step?
Implement just one professional practice from this guide—whether it’s terminal cleaning protocols or installing a smart shunt—to immediately improve your battery performance. Remember, in energy storage systems, knowledge of your true state of charge isn’t just data—it’s power.
Frequently Asked Questions About Deep Cycle Battery State of Charge
What exactly does state of charge (SoC) measure in a deep cycle battery?
State of Charge represents the remaining usable energy in your battery as a percentage of its total capacity. For example, a 100Ah battery at 50% SoC has 50Ah remaining.
Unlike simple voltage readings, SoC accounts for factors like battery age, temperature, and discharge rate. It’s the most accurate way to determine how much runtime you have before needing to recharge.
How often should I check my deep cycle battery’s state of charge?
For optimal maintenance:
- Daily when in active use (especially for solar/RV systems)
- Weekly for seasonal equipment like boats
- Monthly for backup power systems
Always check before and after extended storage periods. Lithium batteries require less frequent checks (monthly) due to their stable discharge curves.
Why does my battery show different voltages at the same state of charge?
Several factors cause voltage variations:
- Temperature: Voltage drops 0.01V per °C below 25°C
- Recent activity: Surface charge can inflate readings by 0.3V after charging
- Battery chemistry: AGM batteries typically read 0.2V higher than flooded at the same SoC
Always let batteries rest 4+ hours for accurate readings.
Can I use a car battery tester to check my deep cycle battery’s SoC?
No, car battery testers measure cranking amps (CCA) which is irrelevant for deep cycle batteries. You need:
- A digital multimeter (0.5% accuracy or better)
- Hydrometer for flooded batteries
- Smart shunt for lithium batteries
Car testers will give dangerously misleading results for SoC determination.
What’s the most accurate way to measure SoC in lithium batteries?
Lithium’s flat discharge curve makes voltage unreliable. Instead use:
- Coulomb counters that track amp-hours in/out
- BMS data from quality systems (Victron, Battle Born)
- Impedance testing for advanced diagnostics
Quality lithium batteries include built-in SoC monitoring that’s 98% accurate when properly calibrated.
How does temperature affect my SoC readings and battery performance?
Temperature impacts batteries in two key ways:
- Voltage readings: Add 0.004V per °C below 25°C to compensate
- Actual capacity: -1% capacity per °C below 20°C
At -20°C, a battery showing 12.6V (100% SoC) might only deliver 60% of its rated capacity. Always use temperature-compensated chargers in extreme climates.
What maintenance tasks should I perform based on my battery’s SoC?
SoC-driven maintenance schedule:
- Below 50%: Immediate recharge to prevent sulfation
- 75-100%: Check electrolyte levels (flooded batteries)
- After full discharge: Equalization charge (flooded only)
- 30-50%: Ideal storage range for lead-acid
Never store lithium batteries at 100% SoC – maintain 40-60% for long-term storage.
Why does my battery monitor show different SoC than my voltage readings?
Common causes of discrepancies:
- Uncalibrated monitors need full charge/discharge cycles
- Voltage sag during high loads distorts readings
- Battery aging changes voltage-SoC relationships
For lead-acid, trust voltage after proper rest. For lithium, trust coulomb counting systems when properly maintained.