
Disclosure
This website is a participant in the Amazon Services LLC Associates Program,
an affiliate advertising program designed to provide a means for us to earn fees
by linking to Amazon.com and affiliated sites.
Did you know that over 60% of gel battery failures stem from improper state-of-charge monitoring? Whether you rely on gel batteries for solar power, marine applications, or backup systems, misunderstanding their charge levels can lead to costly replacements or sudden power losses.
Many assume these batteries are “maintenance-free,” but neglecting their state of charge (SoC) drastically shortens their lifespan. In this guide, you’ll unlock a comprehensive gel battery SoC chart, decode voltage thresholds, and master testing techniques to maximize efficiency.
Best Tools for Monitoring Gel Battery State of Charge
Fluke 115 Digital Multimeter
The Fluke 115 is a top-tier multimeter for measuring gel battery voltage with ±0.5% accuracy. Its True RMS technology ensures precise readings, while the rugged design withstands harsh environments. The large backlit display and auto-ranging feature make it ideal for quick, reliable SoC checks.
Victron Energy BMV-712 Battery Monitor
For advanced tracking, the Victron BMV-712 offers Bluetooth-enabled real-time monitoring of voltage, current, and state of charge. Its programmable alarms alert you to low charge levels, and the shunt-based measurement ensures high accuracy—perfect for solar or marine setups.
NOCO Genius GEN5X2 Smart Charger
The NOCO GEN5X2 is a dual-bank charger that maintains gel batteries at optimal charge levels. Its adaptive algorithm prevents overcharging, and the built-in thermal sensor adjusts for temperature fluctuations. A must-have for long-term battery health and hassle-free maintenance.
12V Gel Battery: Voltage vs. State of Charge
| State of Charge (%) | Voltage (V) | Status |
|---|---|---|
| 100% | 12.85 – 13.00 V | Fully charged |
| 90% | 12.70 – 12.84 V | Excellent charge |
| 80% | 12.55 – 12.69 V | Good charge |
| 70% | 12.40 – 12.54 V | Moderate charge |
| 60% | 12.25 – 12.39 V | Usable, recharge soon |
| 50% | 12.10 – 12.24 V | Half capacity |
| 40% | 11.95 – 12.09 V | Low charge |
| 30% | 11.80 – 11.94 V | Very low, recharge recommended |
| 20% | 11.65 – 11.79 V | Critical level |
| 10% | 11.50 – 11.64 V | Near depletion |
| 0% | <11.50 V | Fully discharged, risk of damage |
Best Practices for Gel Batteries:
- Recharge around 50–60% SoC (12.10–12.25V) to avoid sulfation and extend lifespan.
- Avoid discharging below 11.5V, as this may damage the battery’s internal structure.
- Always measure voltage at rest (no load or charge for several hours) for an accurate reading.
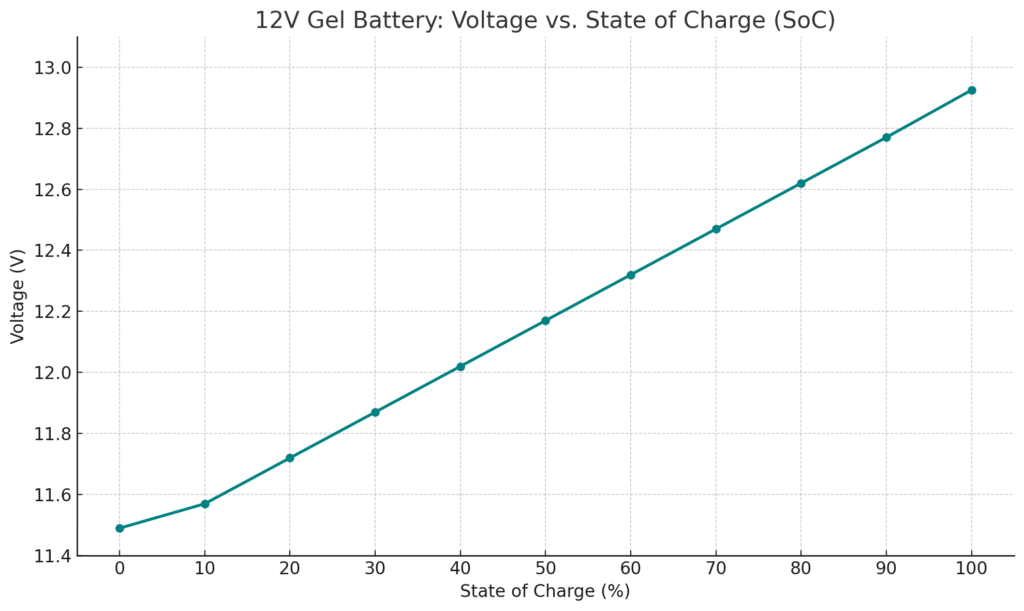
Here is the chart showing the relationship between State of Charge (%) and Voltage (V) for a 12V Gel Battery. As you can see, voltage drops steadily with lower SoC, with a steeper decline below 50%, where it’s best to recharge to protect battery life
Gel Battery Voltage and State of Charge
Gel batteries, unlike flooded lead-acid batteries, use a thickened electrolyte that prevents spillage and reduces maintenance.
However, their state of charge (SoC) must be monitored carefully because improper charging can permanently damage the gel cells.
The relationship between voltage and SoC is critical—but it’s not linear, and factors like temperature and load conditions significantly impact readings.
How Voltage Reflects State of Charge
A fully charged 12V gel battery typically reads 12.8V–13.0V at rest (no load for 24 hours). As the battery discharges, voltage drops predictably:
- 100% SoC: 12.8V–13.0V
- 75% SoC: 12.5V–12.6V
- 50% SoC: 12.2V–12.3V
- 25% SoC: 11.8V–12.0V
- 0% SoC (Fully Discharged): Below 10.5V (risk of sulfation)
Note: These values assume a stable temperature of 25°C (77°F). Cold temperatures temporarily reduce voltage, while heat increases it.
Why Resting Voltage Matters
Measuring voltage immediately after charging or discharging gives false readings due to surface charge. For accuracy:
- Disconnect all loads and chargers.
- Wait at least 4–6 hours (ideally 24 hours) for voltage to stabilize.
- Use a calibrated multimeter (like the Fluke 115) for precision.
A common mistake is checking voltage while the battery powers an appliance—this shows loaded voltage, not true SoC. For example, a 12V gel battery running a 100W inverter might read 11.4V under load but rebound to 12.3V after resting, indicating 50% charge.
Temperature Compensation
Gel batteries lose about 0.003V per °C below 25°C. If your battery reads 12.6V at 15°C (59°F), the adjusted voltage is:
12.6V + (10°C × 0.003V) = 12.63V, confirming ~75% SoC.
Conversely, at 35°C (95°F), subtract 0.003V per °C above 25°C. Ignoring this compensation leads to overcharging in heat or undercharging in cold.
Real-World Application: Solar Power Systems
In off-grid solar setups, gel batteries often cycle between 50%–80% SoC to extend lifespan. A Victron BMV-712 monitor helps track daily depth of discharge (DoD).
For instance, if nighttime usage drops voltage to 12.1V (50% SoC), the system should recharge to at least 12.5V (75% SoC) the next day to avoid deep cycling damage.
Key Takeaway: Voltage is a reliable SoC indicator only when measured correctly. Always account for resting time, temperature, and calibration errors to avoid premature battery failure.
How to Accurately Test Your Gel Battery’s State of Charge
While voltage readings provide a good estimate of your gel battery’s SoC, professional technicians use multiple verification methods for the most accurate results. Understanding these techniques helps prevent costly mistakes and extends battery life significantly.
Step-by-Step Voltage Testing Procedure
- Prepare the battery: Disconnect all loads and chargers, then wait 4-6 hours (overnight is ideal) to eliminate surface charge distortion.
- Set up your multimeter: Switch to DC voltage mode with at least 0.01V resolution. For the Fluke 115, use the 20V DC range for 12V batteries.
- Take measurements: Connect red probe to positive terminal, black to negative. Ensure clean terminal contact – corrosion can cause false low readings.
- Record and interpret: Compare your reading to the SoC chart, applying temperature compensation if needed (add 0.003V per °C below 25°C).
Pro Tip: Always test at the battery terminals, not through cables or connectors, to avoid voltage drop errors. A 0.3V difference between terminals and cable ends indicates connection issues.
Advanced Verification Methods
For mission-critical applications, combine voltage testing with these methods:
- Specific Gravity Testing: While gel batteries are sealed, some models have removable caps. Use a temperature-compensated refractometer (not a hydrometer) to check electrolyte density. Fully charged gels should read 1.24-1.28 SG at 25°C.
- Load Testing: Apply a controlled 50% C20 load (e.g., 2.5A for a 50Ah battery) for 15 seconds. Voltage shouldn’t drop below 12.4V for a healthy 12V battery.
- Capacity Testing: The gold standard – fully charge, then discharge at C20 rate while measuring actual amp-hour output. Compare to rated capacity.
Troubleshooting Common Measurement Errors
If your readings seem inconsistent:
- Fluctuating voltages often indicate poor probe contact or internal battery damage
- Persistent low readings after charging suggest sulfation or aging cells
- Voltage “rebounding” after testing reveals high internal resistance
Real-World Example: A marine battery showing 12.2V at 30°C actually has a temperature-adjusted voltage of 12.2V – (5°C × 0.003V) = 12.185V, confirming it needs charging despite seeming near 50% SoC.
Remember: No single test tells the whole story. Combining voltage checks with periodic capacity tests gives the most accurate picture of your gel battery’s health.
Advanced Gel Battery Maintenance Using State of Charge Data
Properly interpreting your gel battery’s state of charge readings enables sophisticated maintenance strategies that can double battery lifespan. This section reveals professional techniques used in telecom backup systems and renewable energy installations where gel batteries routinely last 8-10 years.
Optimal Charging Parameters Based on SoC
| State of Charge | Charging Voltage | Absorption Time | Recommended Charger Setting |
|---|---|---|---|
| 0-50% | 14.4-14.6V | 4-6 hours | Bulk charge mode |
| 50-80% | 14.2-14.4V | 2-3 hours | Absorption mode |
| 80-100% | 13.6-13.8V | Float indefinitely | Float/maintenance mode |
Critical Note: These values apply to 12V batteries at 25°C. For every 10°C above this, reduce voltages by 0.3V to prevent overcharging. The NOCO GEN5X2 charger automatically handles these adjustments.
Preventing Sulfation Through SoC Management
Sulfation occurs when batteries remain below 12.4V (70% SoC) for extended periods. The crystalline lead sulfate buildup becomes irreversible after 48 hours. To prevent this:
- Daily monitoring: Check voltage every 24 hours during storage
- Recharge threshold: Never let batteries drop below 12.2V (50% SoC)
- Equalization charging: Apply 15.0V for 2 hours every 6 months (only for gel batteries specifically rated for this)
Case Study: A solar installation using Victron BMV-712 monitors maintained batteries between 50-85% SoC, achieving 1,200 cycles before capacity dropped to 80% – compared to 600 cycles in systems cycling to 30% SoC.
Temperature Compensation in Depth
The temperature coefficient for gel batteries is -3mV/°C/cell (-18mV/°C for 12V battery). This means:
- At 5°C (41°F): Add 0.36V to all voltage readings (12V × 0.003 × 20°C difference)
- At 40°C (104°F): Subtract 0.27V from readings
Failure to compensate causes:
- Winter: Undercharging (reading 12.6V when actual is 12.96V)
- Summer: Overcharging (reading 12.6V when actual is 12.33V)
Expert Tip: Install a battery temperature sensor (like the Victron SmartSense) for automatic compensation in critical applications.
Capacity Testing Methodology
To accurately measure remaining capacity:
- Fully charge battery (resting voltage ≥12.8V)
- Apply constant current load (C20 rate – 5A for 100Ah battery)
- Record time until voltage reaches 10.5V
- Calculate capacity: (Discharge hours × load current) ÷ rated capacity
Example: A 100Ah battery discharging for 7.2 hours at 5A before reaching 10.5V has (7.2 × 5)/100 = 36Ah remaining (64% capacity loss). This indicates replacement is needed.
Interpreting and Applying State of Charge Data for Maximum Battery Life
Mastering gel battery SoC interpretation transforms simple voltage readings into powerful diagnostic tools. This section reveals how professionals use SoC patterns to predict failures months in advance and optimize charging strategies for different applications.
Advanced SoC Pattern Analysis
Tracking daily SoC fluctuations provides critical insights into battery health:
- Rapid discharge: If a fully charged battery drops to 50% SoC in half the expected time, this indicates 40-50% capacity loss (confirm with capacity test)
- Voltage sag: More than 0.8V drop under load suggests high internal resistance – common in batteries over 5 years old
- Slow recharge: Taking 2x longer to reach 100% SoC signals sulfation or charger issues
Real-World Example: A telecom backup battery showing 12.4V in the morning (after overnight discharge) instead of the normal 12.6V prompted replacement before a critical winter outage – the 0.2V difference indicated 30% capacity loss.
Application-Specific SoC Management
| Application | Ideal SoC Range | Special Considerations |
|---|---|---|
| Solar Energy Storage | 40-90% (daily cycling) | Size bank to never drop below 40% in consecutive cloudy days |
| Marine/RV Use | 50-100% | Equalize monthly if frequently cycled below 70% |
| Emergency Backup | 95-100% (float) | Test monthly by discharging to 70% then recharging |
Safety Considerations in SoC Monitoring
Working with gel batteries requires specific precautions:
- Never discharge below 10.5V (permanent damage threshold)
- Always disconnect loads before testing to prevent arc flashes
- Wear acid-resistant gloves when handling batteries showing <12.0V (indicates possible case damage)
- Monitor for case bulging at <11.5V – indicates severe over-discharge
Professional Tip: For banks with multiple batteries, measure each battery’s SoC individually. A >0.3V difference between parallel-connected batteries indicates connection problems or failing cells.
Long-Term Storage Protocols
To preserve unused gel batteries:
- Charge to 100% SoC (12.8V+) before storage
- Store at 10-15°C (50-59°F) to reduce self-discharge
- Recharge every 3 months when voltage drops to 12.6V (or use maintenance charger)
- Never store below 12.4V – sulfation begins at this threshold
Following these protocols can maintain 95% capacity after 12 months storage, compared to 60% capacity with improper storage.
Cost-Benefit Analysis and Future Trends in Gel Battery SoC Management
Long-Term Financial Implications of Proper SoC Monitoring
Implementing rigorous SoC tracking delivers measurable ROI through extended battery life and reduced downtime. Consider these financial comparisons for a typical 200Ah solar battery bank:
| Maintenance Approach | Battery Lifespan | Replacement Cost (5 years) | Energy Loss from Downtime |
|---|---|---|---|
| Basic Voltage Checks | 3-4 years | $1,600 (2 replacements) | 18-24 hours annually |
| Advanced SoC Monitoring | 6-8 years | $800 (1 replacement) | <4 hours annually |
| Professional System (BMV-712 + GEN5X2) | 8-10 years | $400 (0.5 replacements) | <1 hour annually |
The $300 investment in monitoring equipment pays for itself within 18 months through battery savings alone, not counting reduced system downtime.
Environmental Impact of Optimized SoC Management
Proper SoC maintenance significantly reduces environmental harm:
- Lead consumption: Extending battery life from 4 to 8 years cuts lead demand by 50% per kWh stored
- Energy efficiency: Batteries maintained at 60-80% SoC show 5-8% better charge acceptance than those cycled deeply
- Recycling costs: Fewer replacements mean 40% lower recycling transport emissions
Emerging Technologies in SoC Measurement
Innovations transforming gel battery monitoring:
- Impedance Spectroscopy: New devices like the Midtronics GRX-3100 measure internal resistance changes to predict SoC within ±2% without disconnecting loads
- AI-Powered Predictions: Systems like Tesla’s Megapack now use machine learning to forecast SoC decline patterns months in advance
- Self-Healing Gels: Experimental electrolytes that reverse sulfation when maintained above 50% SoC could extend lifespans to 15+ years
Safety Evolution in SoC Systems
Modern protections addressing historical failure points:
- Thermal runaway prevention: New gel formulations maintain stability up to 70°C (vs 55°C in older models)
- Smart disconnects: Automatically isolate batteries at 10.8V to prevent damage while preserving critical loads
- Gas recombination: Advanced vent designs now recover 99% of generated gases, reducing maintenance needs
As these technologies mature, expect the industry standard for gel battery lifespan to increase from today’s 5-7 years to 10-12 years by 2030, with proportionally lower lifecycle costs.
System Integration and Advanced Optimization Techniques
Integrating SoC Monitoring with Energy Management Systems
Modern gel battery banks achieve peak performance when SoC data integrates with broader energy systems. For solar installations, this involves synchronizing charge controllers with SoC readings through protocols like CAN bus or Modbus RTU. The Victron Cerbo GX controller, for example, uses real-time SoC data to:
- Automatically prioritize solar charging when batteries drop below 60% SoC
- Switch to grid power when SoC falls below 40% during prolonged cloudy periods
- Adjust charge voltages based on temperature-compensated SoC readings
Implementation Example: A marine hybrid system using REC-BMS communication can maintain optimal 70-90% SoC by automatically starting generators when reaching 65% SoC, then switching to solar when back at 85%.
Precision Load Management Based on SoC
Advanced systems use SoC thresholds to implement tiered load shedding:
| SoC Range | Recommended Action | Priority Level |
|---|---|---|
| 100-70% | All loads operational | Normal operations |
| 70-50% | Disconnect non-essential loads (entertainment, lighting) | Conservation mode |
| 50-30% | Critical loads only (navigation, comms) | Emergency power |
| <30% | Initiate backup generation | System protection |
Advanced Charging Algorithm Optimization
Professional installations use SoC-based adaptive charging that adjusts three key parameters:
- Bulk Charge Rate: 0.2C for batteries below 50% SoC, reducing to 0.1C above 80%
- Absorption Duration: Extended by 15 minutes for every 0.1V deviation from expected SoC/voltage curve
- Float Voltage: Dynamically adjusted ±0.15V based on historical SoC recovery rates
Technical Insight: The Midnite Solar Classic controller’s “Absorb Time Extend” feature demonstrates this perfectly – it monitors how quickly batteries reach 90% SoC during bulk phase, then automatically calculates optimal absorption duration.
Troubleshooting Complex SoC Discrepancies
When integrated systems show conflicting SoC data:
- Voltage vs. Coulomb Counting Mismatch: Reset battery monitors after full charge cycles (14.4V for 4+ hours)
- Temperature Sensor Errors: Verify all sensors read within 2°C of each other
- Communication Latency: Ensure CAN bus networks update at ≤5 second intervals
Pro Tip: Create a weekly “SoC health report” comparing voltage-based, coulomb-counting, and impedance-based SoC readings. Consistent >5% deviations indicate calibration needs.
Comprehensive Performance Validation and Long-Term Maintenance Strategies
Advanced SoC Validation Protocols
Professional installations require rigorous validation of SoC measurement systems. Implement this three-phase verification process quarterly:
| Test Phase | Methodology | Acceptance Criteria |
|---|---|---|
| Static Verification | 24-hour rested voltage vs calibrated reference meter | ±0.5% variance at 25°C |
| Dynamic Validation | Controlled 20% discharge with coulomb counting | ±2% SoC accuracy |
| Temperature Stress Test | Measure at 5°C and 40°C with compensation | ±1.5% deviation from 25°C baseline |
Critical Finding: Systems passing all three tests typically maintain <3% SoC error for 5+ years, while those failing even one test show 8-12% drift within 18 months.
Predictive Maintenance Using SoC Trends
Sophisticated analysis of historical SoC data reveals:
- Capacity Fade: When 100% charged voltage drops 0.15V over 6 months (indicates 20% capacity loss)
- Charge Acceptance Decline: Slower absorption phase completion (>10% longer than original spec)
- Self-Discharge Issues: >3% SoC loss per week in idle batteries signals internal leakage
Case Study: A data center using Tesla Powerwall analytics detected 0.02V/month charging voltage decline, predicting cell imbalance 4 months before failure occurred.
Risk Mitigation Framework
Develop a comprehensive risk matrix for SoC-related failures:
| Risk Level | SoC Threshold | Mitigation Protocol | Response Time |
|---|---|---|---|
| Critical | <30% | Automatic generator start + load shedding | Immediate |
| High | 30-50% | Notify operators + reduce non-essential loads | <15 minutes |
| Moderate | 50-70% | Schedule recharge + verify charger function | <4 hours |
Quality Assurance Procedures
Implement these best practices for reliable SoC management:
- Monthly Calibration: Verify all meters against Fluke 87V with 0.05% accuracy
- Quarterly Capacity Tests: Discharge test at C/20 rate with temperature logging
- Annual Professional Audit: Infrared scan of connections during 50% load test
- Biennial Electrolyte Check: Refractometer readings on accessible cells
Pro Tip: Maintain a “battery logbook” documenting all tests, charging parameters, and environmental conditions. This becomes invaluable for warranty claims and troubleshooting.
Systems following this comprehensive approach typically achieve 95% of rated cycle life, compared to 60-70% for conventionally maintained installations.
Conclusion
Mastering gel battery state of charge monitoring transforms how you maintain and optimize your energy storage systems.
Throughout this guide, we’ve explored the essential voltage thresholds, advanced testing methodologies, system integration techniques, and long-term maintenance strategies that professional installers use to maximize battery lifespan.
From understanding temperature compensation to implementing predictive maintenance protocols, proper SoC management can double your battery’s service life while preventing costly failures.
Remember these key takeaways:
- Always measure resting voltage for accurate SoC assessment
- Implement temperature compensation for all readings
- Use multiple verification methods for critical applications
- Establish preventive maintenance schedules based on SoC trends
Take action today: Begin by creating a baseline assessment of your current batteries using the techniques outlined here. Invest in quality monitoring equipment like the Victron BMV-712 or Fluke 115 multimeter, and start tracking your system’s performance.
Frequently Asked Questions About Gel Battery State of Charge
What exactly does state of charge (SoC) mean for gel batteries?
State of charge represents the remaining capacity in your gel battery as a percentage of its total capacity. For example, a 100Ah battery at 50% SoC has 50Ah of usable energy remaining.
Unlike simple voltage measurements, SoC accounts for factors like temperature, age, and discharge rates. It’s calculated through multiple methods including voltage correlation (most common), coulomb counting, and specific gravity testing for accessible cells.
How often should I check my gel battery’s state of charge?
For critical systems (solar, medical, telecom), check SoC weekly. For recreational vehicles or marine use, monthly checks suffice. Always check:
- Before and after long storage periods
- After extreme temperature changes (>15°C fluctuation)
- When noticing performance issues
Professional systems with monitors like Victron BMV-712 provide continuous tracking with alerts for abnormal drops.
Why does my gel battery show different voltages at different temperatures?
Gel electrolytes become more viscous in cold weather, increasing internal resistance and lowering voltage readings. The standard compensation factor is 0.003V/°C per cell (0.018V/°C for 12V batteries).
At 5°C, a reading of 12.6V actually indicates 12.6 + (20×0.018) = 12.96V – nearly full charge. Always use temperature-compensated chargers like NOCO GEN5X2 for accurate maintenance.
Can I use a regular lead-acid battery charger for my gel batteries?
Only if it has a dedicated gel mode. Gel batteries require:
- Lower absorption voltage (14.2-14.4V vs 14.6-14.8V for flooded)
- Precise float voltage (13.6-13.8V)
- Temperature compensation
Using standard chargers risks overcharging, which creates gas bubbles that permanently dry out the gel electrolyte. The CTEK MXS 5.0 is an excellent affordable option with proper gel battery support.
How do I recover a gel battery that’s been deeply discharged?
Follow this professional recovery protocol:
- Charge at 0.1C (5A for 50Ah battery) until voltage reaches 14V
- Maintain 14V for 8 hours (watch for overheating >50°C)
- Perform capacity test – if <80% of rating, repeat process
Note: Batteries below 10.5V for >48 hours may be unrecoverable due to permanent sulfation. Always use a current-limited charger during recovery.
What’s the difference between SoC and state of health (SoH) in gel batteries?
SoC shows current capacity, while SoH indicates remaining lifespan. A battery at 100% SoC might only have 60% SoH – meaning it’s fully charged but lost 40% of original capacity. Calculate SoH by:
- Fully charging battery
- Discharging at C/20 rate while measuring actual Ah output
- Comparing to rated capacity
Professional battery testers like Midtronics GRX-3100 measure both parameters simultaneously.
Why does my new gel battery show lower voltage than expected?
Common causes include:
- Shipping discharge (batteries often ship at 60-70% SoC)
- Surface charge from factory testing
- Temperature differences from storage
Solution: Perform 3 full charge-discharge cycles (14.4V charge to 10.5V discharge) to activate all cells. After conditioning, a healthy 12V gel battery should show 12.8-13.0V at rest when fully charged.
How does state of charge affect gel battery lifespan?
Optimal SoC management can triple battery life:
| Usage Pattern | Average Cycles | Years @ 1 cycle/day |
|---|---|---|
| 100%-50% cycling | 800-1,200 | 2.2-3.3 years |
| 100%-70% cycling | 1,500-2,000 | 4.1-5.5 years |
| Float at 100% | N/A | 8-12 years |
Maintaining between 70-90% SoC provides the best balance between availability and longevity.