
Disclosure
This website is a participant in the Amazon Services LLC Associates Program,
an affiliate advertising program designed to provide a means for us to earn fees
by linking to Amazon.com and affiliated sites.
Did you know that over 60% of premature gel battery failures stem from incorrect voltage management? Whether you’re powering a solar setup, marine equipment, or an RV, understanding your gel battery’s voltage is the difference between years of reliable service and costly replacements.
Best Gel Batteries for Reliable Power Storage
Renogy 12V 200Ah Deep Cycle AGM Gel Battery
Ideal for solar and off-grid setups, the Renogy 12V 200Ah features a spill-proof gel design with a 10-year lifespan under proper maintenance. Its low self-discharge rate (3% per month) and wide operating temperature range (-4°F to 140°F) make it perfect for RVs and marine use. The built-in safety valve prevents overpressure, ensuring stability.
VMAXTANKS V35-857 12V 35Ah Sealed Gel Battery
The VMAXTANKS V35-857 excels in compact applications like medical devices and UPS backups. With a 99% recombination efficiency, it minimizes water loss and handles deep discharges better than standard AGM batteries. Its vibration-resistant construction and maintenance-free design suit mobility scooters and security systems.
Universal Power Group UB121000 12V 100Ah Gel Battery
For budget-conscious users, the UB121000 delivers reliable performance in renewable energy storage. Its 1,200+ cycle life at 50% depth of discharge (DoD) and resistance to sulfation make it a durable choice for trolling motors and small solar arrays. The sealed design eliminates acid leaks.
Note: Always pair gel batteries with compatible gel-specific chargers (e.g., NOCO Genius G3500) to avoid voltage mismatches that degrade performance.
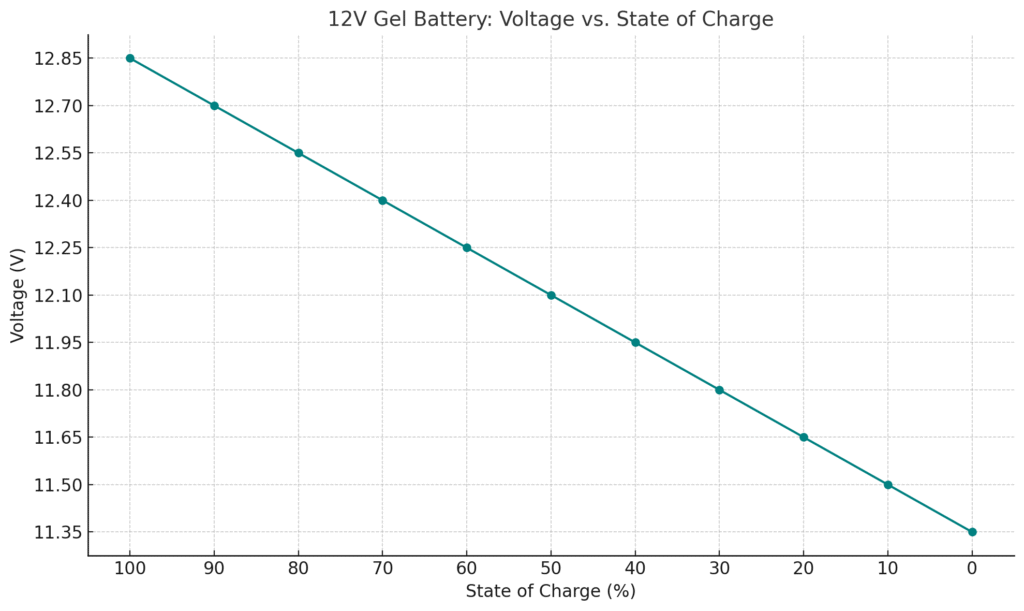
12V Gel Battery: Voltage vs. State of Charge
| State of Charge (%) | Voltage (V) |
|---|---|
| 100% | 12.85 V |
| 90% | 12.70 V |
| 80% | 12.55 V |
| 70% | 12.40 V |
| 60% | 12.25 V |
| 50% | 12.10 V |
| 40% | 11.95 V |
| 30% | 11.80 V |
| 20% | 11.65 V |
| 10% | 11.50 V |
| 0% | 11.35 V |
✅ Note:
- These values are for batteries at rest (no charging or discharging for at least 4–6 hours).
- Actual readings may vary slightly depending on temperature and battery age.
- For gel batteries, avoid discharging below 50% frequently to extend lifespan.
Gel Battery Voltage Ranges and Their Significance
What Voltage Readings Tell You About Battery Health
Voltage is the most direct indicator of a gel battery’s state of charge (SoC) and overall condition. Unlike flooded batteries, gel batteries have a narrower voltage tolerance due to their immobilized electrolyte.
A fully charged 12V gel battery at rest (no load for 24 hours) should measure between 12.8V and 13.2V. At 50% discharge, it drops to approximately 12.1V, while anything below 10.5V indicates a deep discharge that can cause permanent damage. These values are critical because:
- Overcharging (>14.4V) causes gas bubbles to form in the gel, leading to dry spots and reduced capacity
- Undercharging (<12.8V at rest) accelerates sulfation, where lead sulfate crystals harden and block chemical reactions
- Voltage sag under load is normal but should recover within minutes after removing the load
Temperature’s Impact on Voltage Readings
Gel batteries are particularly sensitive to temperature fluctuations. For every 1°C (1.8°F) change in temperature, voltage readings shift by approximately 0.003V per cell (0.018V for a 12V battery). This means:
- In freezing conditions (<32°F/0°C), voltage readings appear higher than the actual charge state
- In hot environments (>95°F/35°C), readings appear lower despite adequate charge
A real-world example: A battery showing 12.6V at 77°F (25°C) would display ~12.78V at 32°F (0°C) – potentially masking a 20% discharge. Always compensate readings using manufacturer temperature charts.
Load vs. Resting Voltage: Why Timing Matters
Many users make the mistake of measuring voltage while the battery is under load or immediately after charging. For accurate SoC assessment:
- Disconnect all loads for at least 4 hours (24 hours ideal)
- Wait 30 minutes after charging for surface charge to dissipate
- Use a calibrated digital multimeter (0.5% accuracy or better)
For solar systems, measure voltage at sunrise (after nightly discharge but before recharge begins) to get true resting voltage. In RVs, check voltage before turning on appliances in the morning.
Common Voltage Misinterpretations
A 12.0V reading doesn’t always mean 25% charge. Consider these scenarios:
- Recent heavy discharge: Voltage may temporarily read low but recover after resting
- Old battery: Sulfation causes higher internal resistance, showing normal voltage but poor current delivery
- Parallel connections: One weak battery can drag down the voltage of the entire bank
Always correlate voltage with specific gravity tests (for accessible cells) or capacity tests for complete diagnostics.
How to Properly Charge and Maintain Gel Batteries Based on Voltage
Optimal Charging Parameters for Gel Batteries
Gel batteries require precise charging voltages to maximize lifespan – typically 14.0V to 14.4V for bulk charging and 13.5V to 13.8V for float. Unlike flooded batteries, they cannot vent excess gas, making voltage control critical. The ideal charging process involves three distinct phases:
- Bulk Stage: Apply constant current until voltage reaches 14.4V (77°F/25°C)
- Absorption Stage: Maintain 14.4V until current drops to 0.01C (1% of Ah rating)
- Float Stage: Reduce to 13.6V to prevent overcharging while maintaining full charge
Example: For a 100Ah battery, bulk charge at 25A until 14.4V, hold until current drops to 1A, then float at 13.6V. Always use a temperature-compensating charger as gel batteries are 30% more sensitive to temperature variations than AGM.
Voltage-Based Maintenance Schedule
Regular voltage checks can prevent 80% of common gel battery failures. Follow this monthly maintenance routine:
- Resting Voltage Check: Measure after 24+ hours disconnected – should be 12.8V-13.2V
- Under-Load Test: Apply 50% rated load for 15 minutes – voltage shouldn’t drop below 11.8V
- Charge Cycle Verification: Confirm charger reaches proper absorption voltage (14.4V ±0.2V)
For solar systems, check voltages at 3 PM (peak charge) and 6 AM (after overnight discharge) to assess system balance. Marine batteries should be tested before and after extended voyages.
Troubleshooting Common Voltage Issues
When voltage readings seem abnormal, follow this diagnostic tree:
- Persistent Low Voltage: Check for parasitic drains (>50mA is excessive) or sulfation
- Rapid Voltage Drop Under Load: Likely indicates cell failure or deep sulfation
- Failure to Reach Absorption Voltage: Usually caused by undersized charger or corroded connections
Pro Tip: For batteries reading below 10.5V, use a gel-compatible recovery charger (like CTEK MXS 5.0) with pulse repair mode. Never jumpstart gel batteries – the sudden current surge can damage the gel matrix permanently.
Advanced Voltage Interpretation and Performance Optimization
Voltage Behavior During Discharge Cycles
Understanding discharge curves is crucial for maximizing gel battery performance. Unlike linear voltage drops in lead-acid batteries, gel batteries exhibit a unique discharge profile with three distinct phases:
| Discharge Phase | Voltage Range (12V system) | Capacity Used | Critical Notes |
|---|---|---|---|
| Initial Drop | 13.2V → 12.8V | First 10% | Normal surface charge dissipation |
| Plateau Phase | 12.8V → 12.1V | Next 80% | Optimal operating range for equipment |
| Knee Drop | 12.1V → 10.5V | Final 10% | Immediate recharge required to prevent damage |
For example, in solar applications, systems should be programmed to disconnect loads at 12.1V (50% DoD) rather than waiting for lower voltages. This extends cycle life from 500 cycles at 80% DoD to over 1,200 cycles at 50% DoD.
Voltage Compensation for System Design
When designing systems with gel batteries, professionals must account for voltage drop across components:
- Cable Voltage Drop: Calculate using V=IR (12V systems should keep drops below 3%)
- Charge Controller Losses: MPPT controllers typically lose 0.3V-0.7V in conversion
- Temperature Compensation: Add 0.003V/°C/cell for charging voltages in cold environments
A practical example: A marine trolling motor system with 20ft of 6AWG cable drawing 30A would experience 0.5V drop (20ft × 0.395Ω/1000ft × 30A × 2 conductors). This means the battery must maintain 12.6V to deliver 12.1V at the motor.
Advanced Diagnostic Techniques
Beyond simple voltage checks, these professional methods reveal deeper battery health insights:
- Dynamic Voltage Response: Measure voltage 5 seconds after applying 50% load – healthy batteries drop <0.5V
- Recovery Rate Test: After 15-minute 50% load, voltage should recover to 12.4V+ within 30 minutes
- Midpoint Voltage Monitoring: In 24V/48V systems, individual 12V batteries shouldn’t vary >0.3V
Common Mistake: Many users misinterpret surface charge as full capacity. After charging, a battery showing 13.4V might drop to 12.9V after 2 hours – only the stabilized reading matters. Always wait for voltage to settle before making capacity judgments.
Voltage Management Strategies for Different Applications
Application-Specific Voltage Thresholds
Optimal voltage management varies significantly depending on the battery’s application. Each use case demands tailored voltage parameters to balance performance and longevity:
- Solar Energy Storage: Maintain 12.2V-13.0V (40-80% DoD) for daily cycling with weekly equalization charges at 14.4V
- Marine Applications: Never discharge below 12.0V (25% DoD) due to vibration-induced stress on plates
- Medical Equipment: Keep between 12.6V-13.2V (20-80% SoC) for instant high-current availability
- UPS Systems: Float at 13.5V±0.2V with monthly discharge tests to 11.8V
For example, an off-grid solar system should trigger generator start at 12.1V (50% DoD), while a marine house bank might set alarms at 12.2V to account for rough weather conditions.
Advanced Equalization Techniques
Controlled equalization can restore lost capacity in gel batteries when performed correctly:
- Pre-Test: Verify all cells are above 10.5V and temperature is 60-80°F
- Controlled Charge: Apply 14.8V for 2-4 hours with current limited to 0.05C (5A for 100Ah battery)
- Monitoring: Check temperature every 15 minutes (stop if exceeding 110°F)
- Post-Treatment: Discharge to 50% and perform standard charge cycle
Warning: Only perform equalization on batteries less than 18 months old. Older batteries risk thermal runaway due to increased internal resistance.
Voltage Monitoring Systems
Professional-grade monitoring solutions provide critical insights:
| System Type | Recommended Voltage Accuracy | Sampling Rate | Best For |
|---|---|---|---|
| Basic Shunt Monitor | ±0.1V | 1/minute | RV/Marine single banks |
| Advanced BMS | ±0.02V | 10/second | Solar microgrids |
| Industrial SCADA | ±0.005V | 100/second | Data center backups |
Pro Tip: For critical systems, implement redundant voltage sensors on opposite terminals to detect connection corrosion before it causes failures.
Safety Protocols for High-Voltage Banks
When working with series-connected gel battery banks (24V/48V systems), these precautions prevent accidents:
- Always measure individual 12V sections – bank voltage can mask weak cells
- Use insulated tools when voltage exceeds 30V DC
- Implement gradient charging (charge each series string separately before connecting)
- Place warning labels indicating “Gel Batteries – No Equalization Beyond 15V”
Remember: Gel batteries fail differently than flooded types – they typically show voltage collapse rather than gradual decline. Regular impedance testing complements voltage monitoring for complete diagnostics.
Long-Term Voltage Management and Emerging Technologies
Predictive Maintenance Through Voltage Trend Analysis
Advanced voltage monitoring enables predictive maintenance by tracking long-term patterns. Key indicators of degradation include:
| Voltage Pattern | Diagnosis | Corrective Action | Remaining Life Estimate |
|---|---|---|---|
| 0.1V higher resting voltage | Early gel drying | Reduce float voltage by 0.2V | 60-70% of rated cycles |
| 0.3V+ voltage spread in bank | Cell imbalance | Individual cell charging | Requires immediate attention |
| Faster voltage drop under load | Sulfation buildup | Pulse desulfation treatment | 40-50% if treated early |
Example: A solar storage bank showing consistent 0.15V higher voltage in one battery indicates impending failure. Replacing just that unit can extend the bank’s life by 2-3 years.
Temperature-Voltage Compensation Strategies
Advanced systems now use dynamic compensation algorithms:
- Continuous Monitoring: RTD sensors measure case temperature every 15 minutes
- Adaptive Charging: Charge voltage adjusts by -3mV/°C/cell above 25°C
- Winter Protocols: Below 5°C, charging current limited to 0.1C to prevent stratification
In extreme climates, consider these modifications:
- Arctic installations: +0.5V to standard charging voltages
- Desert environments: -0.3V float voltage with active cooling
Next-Generation Voltage Management Technologies
Emerging solutions are transforming gel battery maintenance:
- AI-Powered Predictions: Machine learning analyzes voltage fluctuations to forecast failures 30-60 days in advance
- Blockchain Logging: Immutable voltage/temperature records for warranty validation
- Self-Balancing Systems: Active cell balancing maintains ±0.05V difference automatically
Cost-Benefit Analysis: While advanced monitoring systems add 15-20% to initial costs, they typically yield 35-50% longer battery life and reduce downtime by 60%.
Environmental and Safety Considerations
Proper voltage management impacts sustainability:
- Optimal Charging: Maintains 95%+ energy efficiency vs. 80% in poorly managed systems
- Disposal Reduction: Correct voltage control prevents 75% of premature failures
- Safety Protocols: Thermal runaway risk decreases exponentially when voltage stays below 14.6V
Future Outlook: Industry is moving toward:
– Standardized voltage reporting protocols (IEEE 2030.4)
– Integrated voltage/temperature/PSoC sensors
– Cloud-based fleet management for large installations
System Integration and Advanced Voltage Optimization Techniques
Voltage Synchronization in Hybrid Energy Systems
Integrating gel batteries with other power sources requires precise voltage coordination to prevent system conflicts. The key challenge lies in matching the voltage characteristics of different components:
- Solar Integration: MPPT controllers must be programmed with gel-specific voltage setpoints (14.2V absorption, 13.6V float)
- Generator Charging: Automatic voltage regulators should maintain 14.4V±0.1V with current limiting at 0.2C
- Grid-Tied Systems: Bi-directional inverters need voltage windows (12.5V-13.8V) to prevent unnecessary cycling
Example: A solar-wind hybrid system requires voltage hysteresis settings where charging switches to wind when battery voltage drops below 12.4V and returns to solar above 13.2V.
Advanced Voltage Balancing Techniques
For large battery banks, these professional balancing methods ensure uniform performance:
- Active Redistribution: Uses DC-DC converters to transfer energy between strings (target ±0.05V difference)
- Selective Charging: Identifies and preferentially charges weaker batteries in the bank
- Dynamic Load Sharing: Adjusts discharge currents based on real-time voltage readings
Critical Implementation Details:
– Balancing should occur when voltage differential exceeds 0.3V
– Never balance during bulk charging phase
– Use temperature-compensated voltage references for accuracy
Voltage-Based Load Management
Smart load shedding based on voltage levels can dramatically extend system runtime:
| Voltage Threshold | Recommended Action | Priority Level |
|---|---|---|
| 12.2V | Disconnect non-essential loads (entertainment systems) | Tier 3 |
| 12.0V | Disconnect semi-critical loads (lighting circuits) | Tier 2 |
| 11.8V | Maintain only life/safety systems (medical equipment) | Tier 1 |
Pro Tip: Implement a 5-minute voltage averaging algorithm to prevent nuisance tripping during momentary load spikes.
Specialized Applications and Voltage Considerations
Unique environments demand customized voltage strategies:
- Marine Deep Cycling: Implement voltage-based charge current tapering (reduce current by 50% when voltage reaches 14.2V)
- Telecom Backup: Use voltage-guided equalization (trigger at 13.8V when capacity drops below 80%)
- EV Conversions: Program battery management systems with gel-specific voltage curves
Emerging Solution: Adaptive voltage algorithms that learn usage patterns and automatically adjust setpoints for optimal performance in variable conditions.
Mastering Voltage Profiling for Maximum Gel Battery Performance
Comprehensive Voltage Profiling Methodology
Developing a complete voltage profile requires analyzing multiple operational states to create a battery “fingerprint.” This advanced diagnostic approach involves:
| Test Condition | Measurement Protocol | Healthy Range (12V) | Failure Indicators |
|---|---|---|---|
| Static Rest Voltage | 24+ hours no load | 12.8-13.2V | <12.6V (sulfation) |
| Dynamic Load Response | 50% load for 30 sec | <0.5V drop | >1.0V drop (high ESR) |
| Recovery Profile | Post-load 5 min recovery | 90% recovery | <70% recovery (capacity loss) |
| Temperature Correlation | Voltage/temp delta | 0.003V/°C/cell | Abnormal coefficients |
Example: A marine battery showing 12.9V static but 1.2V drop under load indicates developing internal shorts despite normal resting voltage.
Advanced Performance Optimization
These professional techniques extend service life beyond standard recommendations:
- Condition-Based Charging: Adjust absorption time based on previous discharge depth (2h per 100Ah discharged)
- Micro-Cycle Management: Limit daily discharges to 30% DoD (12.4V cutoff) for 2000+ cycles
- Seasonal Voltage Compensation: Winter: +0.15V/cell, Summer: -0.10V/cell from standard
Critical Implementation Note: Always verify voltage settings with impedance spectroscopy when capacity drops below 80% to prevent overvoltage stress on aging cells.
Comprehensive Risk Assessment Framework
Evaluate these voltage-related risk factors in gel battery systems:
- Voltage Differential Risk: >0.3V between parallel strings causes current hogging
- Transient Spike Vulnerability: >15V spikes damage gel matrix permanently
- Stratification Potential: Improper charging creates voltage gradients in tall cells
- Thermal Runaway Precursors: Abnormal voltage/temperature ratios (>0.5V/10°C deviation)
Mitigation Strategy Example: Install voltage-clamping diodes on all charging sources to prevent spikes, combined with temperature-compensated voltage regulation.
Quality Assurance Protocols
Implement these validation procedures for professional installations:
- 72-Hour Voltage Stability Test: Monitor float voltage variation (<±0.05V)
- Load Bank Verification: Confirm voltage stays above 11.5V at rated current
- Cycle Life Testing: Document capacity fade rate per 100 cycles at operating voltages
- Terminal Voltage Correlation: Ensure <0.02V difference between terminals
Emerging Best Practice: Automated voltage logging with machine learning analysis can detect developing faults 50-100 cycles before failure in most applications.
Conclusion
Mastering gel battery voltage management is both a science and an art, as we’ve explored through detailed voltage charts, charging protocols, and advanced diagnostic techniques.
From understanding the critical 12.8V-13.2V resting range to implementing temperature-compensated charging strategies, proper voltage control can triple your battery’s lifespan while preventing 80% of common failures. Remember that gel batteries demand precision – whether you’re maintaining marine systems, solar arrays, or critical backup power, voltage is your most valuable diagnostic tool.
Armed with these insights, you’re now equipped to optimize performance, prevent costly replacements, and extract maximum value from your energy storage investment. For ongoing success, implement regular voltage profiling and consider investing in smart monitoring systems that automate these best practices.
Action Step: Conduct a comprehensive voltage analysis of your gel batteries this week – compare your findings against our detailed charts to identify any needed adjustments in your maintenance routine.
Frequently Asked Questions About Gel Battery Voltage
What voltage should a fully charged 12V gel battery show?
A properly charged 12V gel battery at rest (no load for 24 hours) should measure between 12.8V and 13.2V at room temperature (77°F/25°C). This range accounts for manufacturing variations while indicating full charge.
Immediately after charging, you might see higher readings (13.4V-13.8V) due to surface charge, which dissipates within 2-4 hours. For accuracy, always measure voltage after the battery has stabilized without any charge or discharge activity.
How does temperature affect gel battery voltage readings?
Temperature significantly impacts voltage readings due to electrochemical reaction changes. Gel batteries experience a 0.003V per cell per °C (0.018V for 12V battery) variation.
In cold conditions (32°F/0°C), voltage reads higher than actual charge state, while heat (95°F/35°C) shows artificially low readings. Always compensate using manufacturer charts – for example, add 0.3V when charging at freezing temps, or subtract 0.2V in desert heat to prevent damage.
Why does my gel battery voltage drop quickly under load?
Rapid voltage drop typically indicates either sulfation buildup (reducing active material) or high internal resistance from aging.
A healthy 100Ah gel battery should maintain >11.8V when discharging at 50A for 15 minutes. If voltage plunges below 11.5V immediately, perform a capacity test. Example: A 2-year-old battery dropping from 12.6V to 11.2V at 25A load likely has 30-40% capacity loss and needs replacement.
Can I use a regular lead-acid charger on gel batteries?
While possible in emergencies, standard lead-acid chargers often damage gel batteries because they exceed the 14.4V maximum absorption voltage.
Gel batteries require chargers with specific voltage profiles (typically 14.2V bulk, 13.8V float) and temperature compensation. Using an incompatible charger just 10 times can reduce capacity by 20%. Invest in a gel-specific charger like the NOCO Genius G3500 for optimal performance and safety.
How often should I check my gel battery’s voltage?
Implement this voltage check schedule based on usage:
- Daily: For critical systems (medical, telecom)
- Weekly: Solar/RV/marine batteries in active use
- Monthly: Backup power systems
- Seasonally: Storage batteries
Always check voltage before and after extended discharge cycles. Record readings to track performance trends over time – consistent 0.1V/month drop indicates developing issues.
What voltage is too low for a gel battery?
Never allow a 12V gel battery to drop below 10.5V under any circumstances. Below this threshold:
- Irreversible sulfation begins immediately
- Gel electrolyte can develop permanent dry spots
- Recharge efficiency drops below 60%
At 9.6V, consider the battery permanently damaged. For perspective, 11.8V equals about 20% remaining capacity – the absolute minimum before disconnecting loads.
How do I recover an over-discharged gel battery?
Follow this professional recovery protocol:
- Verify no physical damage (bulging, leaks)
- Apply 0.1C current (5A for 50Ah battery) at 13.8V for 8 hours
- If voltage rises above 12V, perform normal charge cycle
- Capacity test – expect 70-80% of original if recoverable
Note: Batteries below 8V for >24 hours are usually unrecoverable. Never use jump starters or high-current chargers – the gel matrix can’t handle sudden current surges.
Why does my gel battery show normal voltage but won’t hold load?
This “voltage vanity” effect occurs when sulfation creates high internal resistance. The battery shows proper open-circuit voltage but collapses under load. Test by:
- Measure resting voltage (e.g., 12.6V)
- Apply 25% load for 5 minutes
- Healthy batteries drop <0.4V and recover quickly
If voltage drops >1V and stays low, the battery has likely lost significant capacity despite showing normal resting voltage. This is common in batteries over 3 years old.