
Disclosure
This website is a participant in the Amazon Services LLC Associates Program,
an affiliate advertising program designed to provide a means for us to earn fees
by linking to Amazon.com and affiliated sites.
Mastering this curve helps prevent premature battery failure and ensures reliable power. You can maximize efficiency and make informed decisions about your energy system. It solves the problem of unexpected power drops and capacity loss.
This complete guide will explain the curve’s flat voltage plateau, depth of discharge impacts, and expert tips for monitoring. You will learn how to interpret voltage sag and capacity ratings for better battery management.
Best Tools for Analyzing the LiFePO4 Battery Discharge Curve
Victron Energy SmartShunt 500A – Best Overall Monitor
The Victron Energy SmartShunt provides precise real-time tracking of your battery’s state of charge directly from the voltage curve. Its Bluetooth connectivity allows for easy monitoring via a smartphone app. This tool is ideal for visualizing depth of discharge and preventing harmful deep cycles in solar or RV systems.

- ALL-IN-ONE SMART BATTERY MONITOR: The Victron SmartShunt is a smart all in…
- DETAILED IN-APP INSIGHTS: Battery monitor data is conveniently presented in…
- PRECISION SHUNT TECHNOLOGY: The Smart Shunt uses highly accurate shunt…
Klein Tools MM420 Multimeter – Best Budget Tester
For hands-on voltage measurement, the Klein Tools MM420 is a reliable, affordable option. It offers accurate DC voltage readings crucial for plotting points on your discharge curve. Its rugged design and clear display make it perfect for DIY enthusiasts and technicians performing regular battery health checks.

- VERSATILE FUNCTIONALITY: Measures AC/DC voltage up to 600V, 10A AC/DC…
- LEAD-ALERT PROTECTION: LEDs on the meter illuminate to indicate proper test…
- BACKLIT DISPLAY: LCD shows clear readings in low-light conditions for…
QOZO Battery Capacity Tester – Best for Lab Analysis
The QOZO Battery Capacity Tester automates discharge curve analysis with programmable load currents and data logging. It generates detailed voltage vs. capacity graphs, providing professional-grade insights. This is the recommended tool for engineers, researchers, or anyone needing to verify a battery’s true rated capacity and performance.
What is a LiFePO4 Discharge Curve and Why It Matter
Below is a representation of the voltage versus state of chart
| State of Charge | Voltage (Approx.) |
|---|---|
| 100% | 13.6 – 14.4V (charging / full absorption) |
| 90% | ~13.4V |
| 80% | ~13.3V |
| 70% | ~13.25V |
| 60% | ~13.2V |
| 50% | ~13.1V |
| 40% | ~13.0V |
| 30% | ~12.9V |
| 20% | ~12.8V |
| 10% | ~11.5 – 12.5V (beginning of steep drop) |
| 0% | 10.0 – 11.0V (BMS cutoff range) |
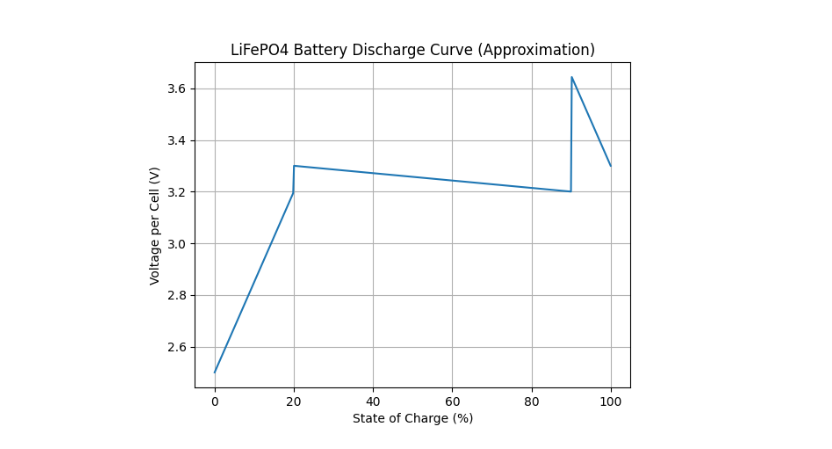
A LiFePO4 discharge curve is a graphical plot of battery voltage versus its state of charge (SoC) or capacity used. It visually maps how voltage behaves as energy is drained. This chart is a critical diagnostic tool for understanding battery health and performance.
Unlike other chemistries, LiFePO4 has a uniquely flat voltage plateau. This characteristic is both a benefit and a challenge for accurate monitoring. Understanding this curve is essential for proper battery management system (BMS) calibration and preventing damage.
Key Components of the Discharge Graph
The curve is not a single line but a story with distinct phases. Each segment reveals important information about the battery’s condition and remaining energy.
- Initial Voltage Drop: A small, quick dip from the resting open-circuit voltage (OCV) as load is applied. This indicates internal resistance.
- The Flat Plateau: The long, stable middle section where voltage changes very little (typically between 13.2V and 12.8V for a 12V system). Most usable capacity lies here.
- The Knee Point: The sharp voltage drop at the end, signaling the battery is nearly empty. Discharging beyond this point causes severe damage.
Practical Importance for Users
For anyone relying on LiFePO4 batteries, this curve translates directly to real-world use. It informs how you monitor your system and plan your energy consumption.
Primarily, it explains why voltage alone is a poor SoC indicator during the plateau. A battery at 80% SoC and 20% SoC can show nearly identical voltage. You need a shunt or coulomb counter for accuracy.
Furthermore, the curve dictates safe operating limits. By knowing where the “knee” occurs for your specific cells, you can program your BMS to cut off discharge, preventing deep discharge and dramatically extending cycle life. This makes understanding your battery’s unique profile non-negotiable for longevity.
How to Read and Interpret Your Battery’s Discharge Profile
Interpreting a LiFePO4 discharge curve allows you to predict performance and spot issues. You must know what to look for on the voltage versus capacity graph. This skill turns raw data into actionable insights for your power system.
Key factors like load current and temperature directly shape the curve’s appearance. A proper reading accounts for these variables. Let’s break down the analysis process into clear, practical steps.
Step-by-Step Analysis Guide
Follow this method to systematically evaluate your battery’s discharge data from a tester or monitor.
- Identify the Voltage Plateau: Locate the long, flat section. Note its starting and ending voltage. A shorter or sloped plateau can indicate aging or high internal resistance.
- Pinpoint the Knee Voltage: Find where the line curves sharply downward. This is your critical low-voltage disconnect point. It typically occurs around 10-20% State of Charge (SoC).
- Calculate Actual Capacity: Measure the total capacity (in Amp-hours) from 100% SoC to the knee point. Compare this to the battery’s rated capacity to assess health.
Factors That Alter the Curve Shape
The ideal textbook curve changes under real-world conditions. Recognizing these shifts prevents misinterpretation of your battery’s health.
- Discharge Rate (C-rate): Higher currents cause greater voltage sag and a lower, shorter plateau. The delivered capacity may be reduced.
- Temperature: Cold temperatures lower overall voltage and reduce available capacity. The curve appears compressed downward.
- Battery Age & Health: As cells degrade, the plateau shortens and internal resistance increases. This causes a more pronounced initial voltage drop.
| Factor | Effect on Discharge Curve | Practical Implication |
|---|---|---|
| High Discharge Rate | Lower voltage plateau, sharper knee | Less usable capacity under heavy load |
| Low Temperature | Entire curve shifts downward | Plan for reduced runtime in cold weather |
| Cell Aging | Plateau shortens, voltage drop increases | Signals need for capacity test or replacement |
Optimizing Performance Using Discharge Curve Data
You can actively use discharge curve insights to enhance your battery system’s efficiency and lifespan. This data informs critical settings and usage habits. It transforms from passive information into an active management tool.
Proper application of this knowledge prevents premature failure and maximizes return on investment. The goal is to operate within the battery’s ideal parameters. Let’s explore the key optimization strategies.
Setting Accurate BMS Voltage Cutoffs
The Battery Management System (BMS) protects your cells, but it needs correct parameters. The discharge curve provides the exact data for these settings.
Use the curve’s knee point voltage to set your low-voltage disconnect (LVD). This prevents deep discharge damage. Set the high-voltage cutoff just below the end of the charge curve’s absorption phase.
- Low Voltage Disconnect: Set 0.1-0.2V above the observed knee point. This provides a safety margin.
- Cell Balancing Range: Initiate balancing only in the upper voltage range (e.g., above 3.45V per cell) where the curve is steeper and SoC is more voltage-sensitive.
Maximizing Cycle Life and Capacity
Strategic cycling based on the discharge profile can double or triple your battery’s useful life. Avoid the extremes shown on the graph.
The flattest part of the plateau represents the sweet spot for depth of discharge (DoD). Regularly cycling between 20% and 80% SoC minimizes stress. This avoids the high-stress regions at the very top and bottom of the curve.
Planning for Real-World Loads
Match your energy consumption to the battery’s performance profile. Understand how your specific loads affect the voltage.
High-power devices cause temporary voltage sag, as shown on high C-rate curves. Plan for this dip to avoid triggering low-voltage alarms prematurely. If your system uses a voltage-based SoC meter, calibrate it using points from the charge curve, which is often more voltage-sensitive, for better accuracy.
Common LiFePO4 Discharge Curve Problems and Solutions
Even with a great battery, you may encounter discharge profile issues. Recognizing abnormal curve shapes helps diagnose problems early. This section links symptoms on the graph to real-world causes and fixes.
Deviations from the expected flat plateau often indicate stress, imbalance, or failure. Prompt identification and correction protect your investment. Let’s troubleshoot the most common discharge curve anomalies.
Symptom: Steeply Sloping Plateau (Reduced Capacity)
A plateau that angles downward significantly indicates high internal resistance or capacity loss. The voltage drops steadily under load instead of staying flat.
Potential Causes and Fixes:
- Low Temperature: Batteries operate less efficiently in the cold. Solution: Insulate the battery compartment or provide moderate heating.
- High C-rate Discharge: Exceeding the recommended continuous discharge rate. Solution: Reduce the load or upgrade to a battery with a higher current rating.
- Aging Cells: Natural degradation over many cycles. Solution: Perform a capacity test. If capacity is below 80% of rating, consider replacement.
Symptom: Shortened Plateau & Early Knee Point
The flat section ends prematurely, and the voltage knee occurs much earlier than expected. This means the battery delivers less usable energy than it should.
Potential Causes and Fixes:
- Cell Imbalance: One weak cell in the pack reaches minimum voltage first, triggering the BMS to cut off the entire pack. Solution: Perform a full balance cycle and monitor individual cell voltages.
- Incorrect State of Charge Calibration: The battery wasn’t truly at 100% when the test started. Solution: Perform a full, controlled charge with a proper absorption stage before testing.
- Partial State of Health (SoH) Loss: General wear from deep cycling or high temperatures. Solution: Re-evaluate your depth of discharge habits and operating temperature range.
| Curve Symptom | Likely Diagnosis | Immediate Action |
|---|---|---|
| Voltage “Steps” or Dips | High-resistance connection or faulty cell | Check and torque all terminal connections |
| Overall Lower Voltage | Very cold ambient temperature | Warm battery to room temperature and retest |
| Inconsistent Curve Shape | Poor test conditions or varying load | Re-test with a constant, rated load current |
Regularly capturing and reviewing your battery’s discharge profile is the best preventative maintenance. It acts as an early warning system, allowing you to address small issues before they lead to complete failure. A stable, flat plateau is the sign of a happy, healthy LiFePO4 battery.
LiFePO4 vs. Other Chemistries: Discharge Curve Comparison
The LiFePO4 discharge profile is fundamentally different from lead-acid or other lithium types. Comparing these curves highlights the unique advantages and considerations of each technology. This knowledge is crucial for selecting the right battery for your application.
Voltage behavior under load directly impacts system design and component compatibility. A steep curve requires different management than a flat one. Let’s analyze the key graphical differences.
Comparison to Lead-Acid (AGM/Gel)
Lead-acid batteries have a continuously sloping discharge curve. Voltage declines steadily from start to finish, making State of Charge (SoC) estimation via voltage relatively straightforward.
- Voltage Stability: LiFePO4 maintains a stable voltage (flat plateau) for 80% of discharge, while lead-acid voltage drops consistently. This means devices run more efficiently on LiFePO4.
- Useable Capacity: You can safely use ~90% of a LiFePO4’s rated capacity. Using more than 50% of a lead-acid battery’s capacity drastically shortens its life.
- Knee Point: LiFePO4 has a very sharp “knee,” while lead-acid curves taper gradually. This makes the LiFePO4 end-of-discharge much more abrupt.
Comparison to NMC/Lithium-Ion
Lithium Nickel Manganese Cobalt Oxide (NMC) batteries, common in EVs, have a different profile. Their curve is more linear and sloping than LiFePO4’s distinct plateau.
- Slope vs. Plateau: NMC offers a higher average voltage but a steadily declining one. LiFePO4 provides consistent power delivery until near depletion.
- Voltage Range: A 12V NMC battery operates over a wider voltage range (e.g., 14.4V to 10V). A 12V LiFePO4 stays in a narrow band (13.4V to 12.0V) for most of its cycle.
- SoC Estimation: Voltage-based SoC estimation is somewhat easier with NMC due to its slope. LiFePO4’s flat plateau necessitates coulomb counting for accuracy.
| Chemistry | Discharge Curve Shape | Key Advantage | Primary Challenge |
|---|---|---|---|
| LiFePO4 | Very Flat Plateau, Sharp Knee | Stable voltage, long cycle life, safety | SoC hard to gauge by voltage alone |
| Lead-Acid (AGM) | Continuous Linear Slope | Low cost, simple voltage-based SoC | Low useable capacity, short cycle life |
| NMC Lithium | Moderate Linear Slope | High energy density, high voltage | Lower thermal stability, faster aging |
This comparison shows why LiFePO4 is ideal for applications needing stable voltage and deep cycling. Its flat curve is perfect for solar storage, RVs, and marine use. Choosing a battery means choosing its discharge profile behavior.
Advanced Analysis: C-Rate and Temperature Effects on Discharge
The standard LiFePO4 discharge curve assumes a specific, low discharge rate at room temperature. Real-world conditions are rarely ideal. Understanding how C-rate and temperature distort the curve is essential for accurate system sizing and expectation management.
These factors change the voltage profile and the total energy you can extract. Ignoring them leads to unexpected power loss. Let’s examine their specific impacts in detail.
Impact of Discharge Rate (C-Rate)
The C-rate is the discharge current relative to the battery’s capacity. A 0.5C rate means discharging at half the amp-hour rating per hour.
- Higher C-Rates: Cause immediate voltage sag and lower the entire plateau. The curve appears compressed downward, and the knee point occurs earlier, delivering less total capacity.
- Lower C-Rates: Produce a curve closest to the ideal, with a higher, flatter plateau. More of the rated capacity is delivered, and the knee voltage is lower.
- Pulse vs. Continuous: Short, high-current pulses may show recovery (voltage bounce-back) on the curve, while continuous high load shows sustained depression.
Impact of Operating Temperature
Temperature profoundly affects chemical reaction rates inside the battery. This is clearly visible on the discharge graph.
- Low Temperatures (<10°C / 50°F): Increase internal resistance, lowering voltage and capacity. The entire curve shifts downward, and the plateau shortens significantly. Heating is often required for full performance.
- High Temperatures (>35°C / 95°F): Can slightly increase capacity and lower internal resistance, raising the curve. However, sustained high temperatures accelerate permanent capacity loss and degrade cycle life.
- Ideal Temperature (15-25°C / 59-77°F): Provides the optimal balance of performance, capacity, and longevity as shown in manufacturer datasheets.
How to Compensate in System Design
To mitigate these effects, design with margins. Select a battery with a capacity rating 20-30% higher than your calculated need to allow for high C-rate and cold weather losses.
Use a temperature sensor with your BMS or charge controller. This allows for automatic voltage compensation during charging. For critical cold-weather applications, consider a thermostatically controlled battery heater to maintain optimal operating temperature.
How to Create Your Own LiFePO4 Battery Discharge Curve
Generating a custom discharge curve for your specific battery pack is invaluable. It provides a real-world baseline for health monitoring and system calibration. This hands-on test reveals the true performance of your cells under your conditions.
You need basic equipment and a methodical process. The goal is to capture voltage data at regular capacity intervals. Follow this step-by-step guide to create an accurate profile.
Required Equipment and Setup
Gather the right tools before starting. Accuracy depends on proper measurement and load control.
- Electronic Load or High-Wattage Resistor: To provide a constant discharge current. A programmable DC load is ideal.
- Precision Voltmeter or Data Logger: To record voltage at set intervals. A simple data-logging multimeter works well.
- Coulomb Counter or Shunt-Based Monitor: To track the exact Amp-hours removed (e.g., a Victron SmartShunt).
- Fully Charged Battery: Start at a verified 100% State of Charge with a completed absorption and float stage.
Step-by-Step Testing Procedure
Consistency is key. Perform the test in a stable, room-temperature environment.
- Set a Constant Discharge Current: Choose a moderate C-rate, like 0.2C (e.g., 20A for a 100Ah battery). This balances test time and accuracy.
- Begin Discharging and Log Data: Start the load and begin recording voltage and removed capacity (Ah) every 5 minutes or at every 5% SoC increment.
- Stop at the Cut-off Voltage: Continue until the battery voltage reaches the manufacturer’s recommended cut-off (e.g., 2.5V per cell or 10V for a 12V pack). Do not exceed this limit.
- Plot the Data: Enter your (Voltage, Capacity) data pairs into spreadsheet software. Create an X-Y scatter plot with Capacity (Ah) on the X-axis and Voltage (V) on the Y-axis.
Interpreting Your Custom Curve
Analyze your plotted line against the manufacturer’s datasheet curve. Look for the key features discussed earlier: the initial drop, flatness of the plateau, and sharpness of the knee.
Note the total delivered capacity in Amp-hours. This is your pack’s true capacity at that C-rate and temperature. A significant shortfall from the rated capacity indicates aging or possible cell issues.
Save this curve as a benchmark. Repeat the test every 6-12 months. Comparing new curves to your original baseline is the most effective way to track battery degradation over time and predict end-of-life.
Conclusion: Mastering Your LiFePO4 Battery’s Performance
Understanding the LiFePO4 discharge curve unlocks predictable power and maximum lifespan. This graph is your battery’s vital sign, revealing health, capacity, and efficiency. It transforms guesswork into precise energy management.
The key takeaway is to monitor capacity, not just voltage, during the flat plateau. Use a coulomb counter for accurate State of Charge readings. Set your BMS protections based on your battery’s unique knee point.
Now, apply this knowledge. Test your own battery, analyze its curve, and optimize your system settings. This proactive step ensures reliable performance for years.
You now have the expert insight to master your energy storage. Use it with confidence.
Frequently Asked Questions about LiFePO4 Discharge Curves
What is the typical voltage range for a 12V LiFePO4 battery during discharge?
A healthy 12V LiFePO4 battery (4 cells) typically operates between 13.4V and 12.0V for 80% of its discharge cycle. This is the flat plateau region. The voltage stays remarkably stable here, which is a key benefit for running sensitive electronics.
The voltage will quickly rise above 13.4V when nearly full and drop sharply below 12.0V when nearly empty at the “knee point.” Your system’s low-voltage cutoff should be set around 12.0V to protect the cells.
How can I tell my LiFePO4 battery’s State of Charge from the voltage?
During the flat middle section of the discharge curve, you cannot accurately gauge State of Charge (SoC) by voltage alone. A reading of 13.0V could mean 90% SoC or 30% SoC. This is the biggest challenge with LiFePO4 monitoring.
You must use a coulomb counter or shunt-based battery monitor (like a Victron SmartShunt) that tracks amp-hours in and out. These devices provide accurate SoC readings regardless of the flat voltage plateau.
Why does my LiFePO4 battery voltage drop quickly under load?
A rapid initial voltage drop when a load is applied is normal and indicates the battery’s internal resistance. This appears as the first small dip on the discharge curve. The voltage often recovers slightly once the load stabilizes.
If the voltage drop is excessive or the voltage stays very low, it may indicate a high C-rate discharge, very cold temperatures, or a battery with aging cells that has developed higher internal resistance.
What does a “knee point” on the discharge curve mean?
The knee point is the sharp downward curve at the end of the discharge graph. It signals that the battery is nearly empty and cell voltage is about to plummet. Discharging beyond this point causes severe stress and damage.
Identifying your specific battery’s knee point voltage is critical. It is the primary data point for setting your Battery Management System (BMS) low-voltage disconnect to prevent harmful deep discharge cycles.
How does cold temperature affect the LiFePO4 discharge profile?
Cold temperatures significantly lower the entire discharge curve. The voltage plateau is lower and shorter, reducing available capacity. You may see 20-30% less usable energy at freezing temperatures compared to room temperature.
The chemical reactions inside the battery slow down in the cold, increasing internal resistance. For reliable winter performance, keep batteries above 10°C (50°F) or use models with built-in heating systems.
What is the best way to test my own battery’s discharge curve?
The best method is to use a constant current electronic load and a data logger. Fully charge the battery, then discharge it at a steady rate (like 0.2C) while recording voltage at regular time or capacity intervals.
Plot this voltage vs. capacity data in a spreadsheet. Compare your resulting curve to the manufacturer’s datasheet. This hands-on test reveals your pack’s true health and actual capacity.
How often should I perform a full discharge test?
For most users, performing a full capacity discharge test once or twice a year is sufficient. This establishes a baseline when the battery is new and then tracks capacity degradation over time.
Frequent full discharges for testing are not recommended, as they add unnecessary wear cycles. Instead, rely on a quality monitor for daily SoC tracking and save full tests for periodic health checks.
Can two different LiFePO4 brands have different discharge curves?
Yes, discharge curves can vary between brands and even between different cell models from the same manufacturer. Differences in internal chemistry, electrode design, and internal resistance all shape the curve.
Always refer to the specific datasheet for your battery cells. The general flat-plateau shape will be consistent, but the exact voltage values and knee point may differ, affecting your BMS settings.