
Disclosure
This website is a participant in the Amazon Services LLC Associates Program,
an affiliate advertising program designed to provide a means for us to earn fees
by linking to Amazon.com and affiliated sites.
A LiFePO4 battery’s voltage typically ranges from 2.5V (fully discharged) to 3.65V (fully charged) per cell, with 3.2V being its nominal voltage.
Understanding this voltage range is crucial for maximizing battery performance, ensuring safety, and prolonging lifespan. Unlike traditional lead-acid batteries, LiFePO4 (Lithium Iron Phosphate) batteries offer a more stable voltage curve and longer cycle life, making them increasingly popular in applications from electric vehicles to solar energy storage.
Have you ever wondered how to tell if your LiFePO4 battery is charged or needs recharging without guesswork? This article unpacks the LiFePO4 battery voltage chart in detail, showing you exactly what voltage readings mean at every stage of charge.
Best LiFePO4 Battery Voltage Meters for Accurate Monitoring
To properly track your LiFePO4 battery’s voltage and maintain optimal performance, having a reliable voltage meter or battery monitor is essential. Here are three top-rated products trusted by professionals and enthusiasts alike:
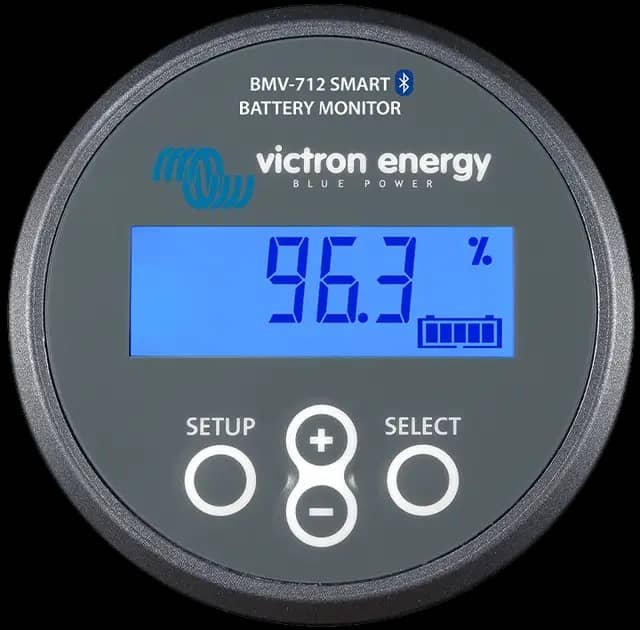
Victron BMV-712 Smart Battery Monitor
This monitor offers precise voltage and current readings with Bluetooth connectivity. Its user-friendly app lets you track battery health remotely, making it perfect for RVs, boats, or off-grid solar systems.
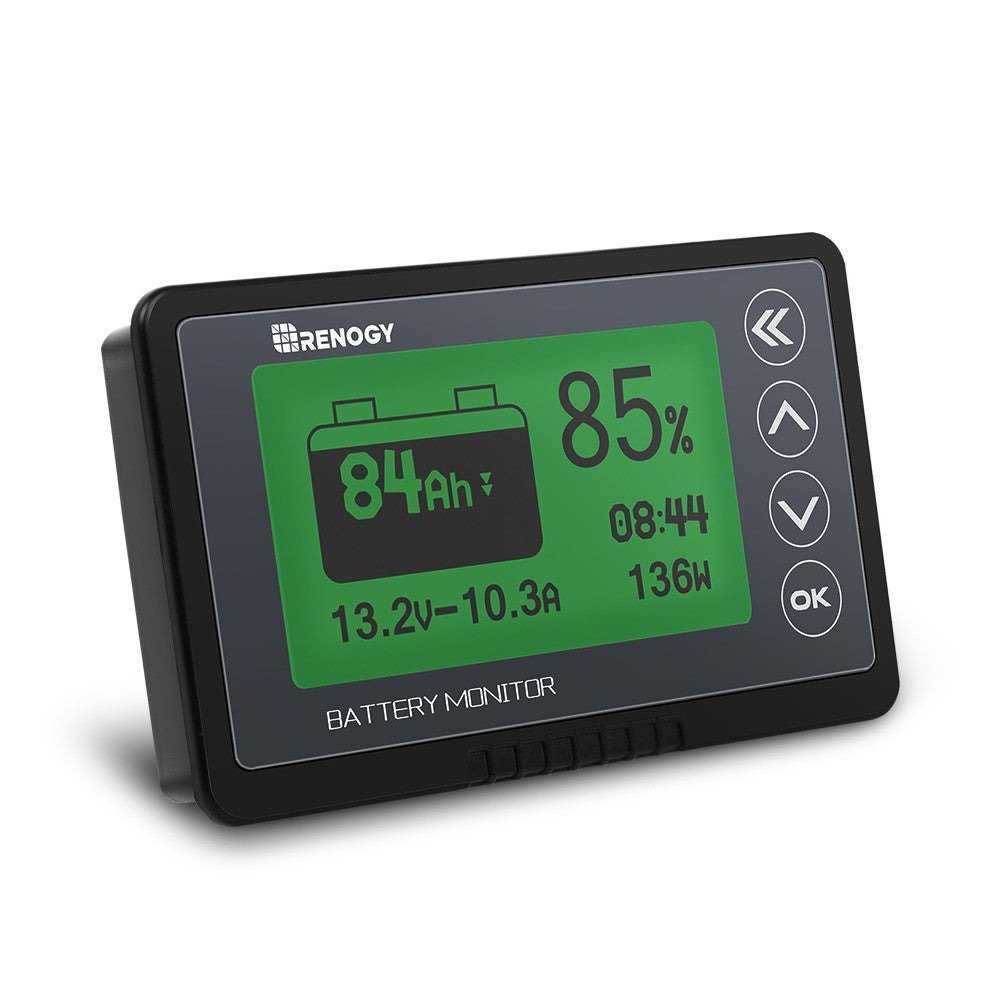
Renogy 500A Battery Monitor
Renogy’s monitor features a clear LCD display and real-time data tracking. It’s easy to install and ideal for DIY solar setups, providing accurate voltage and state-of-charge info for LiFePO4 batteries.
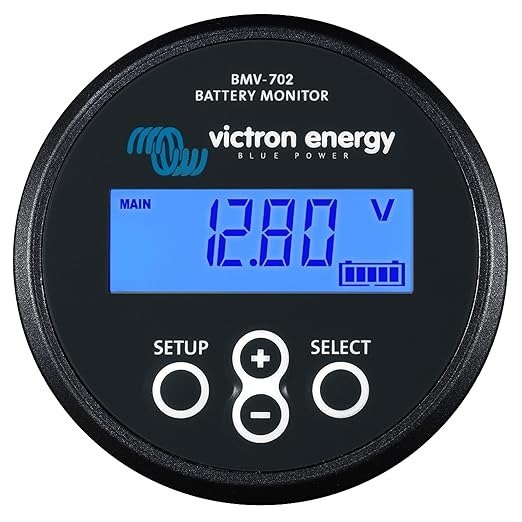
Victron BMV-702 Battery Monitor
Known for its reliability and detailed analytics, this monitor gives you instant voltage and capacity updates. It’s built tough for harsh environments and supports various battery types, including LiFePO4.
What Is the Ideal Voltage Range for a LiFePO4 Battery?
Understanding the ideal voltage range for your LiFePO4 battery is key to maintaining its health and ensuring peak performance. LiFePO4 cells have a unique voltage profile compared to other lithium-ion batteries, characterized by a flat voltage curve during discharge, which makes monitoring easier and more reliable.
The typical voltage range per cell is:
- Fully Charged: 3.60 to 3.65 volts
- Nominal Voltage: Around 3.2 volts
- Fully Discharged: Approximately 2.5 volts (discharging below this can damage the battery)
For a common 12.8V LiFePO4 battery pack (which consists of 4 cells in series), this means:
- Fully charged voltage is about 14.4V to 14.6V
- Nominal voltage is roughly 12.8V
- Fully discharged voltage is around 10.0V
Here’s a detailed LiFePO4 Battery Voltage Chart to clarify the state of charge (SOC) based on voltage:
| Battery Voltage (12.8V Pack) | Approximate State of Charge (SOC) | Battery Condition |
| 14.6 V | 100% | Fully charged |
| 14.0 V | 90% | High charge |
| 13.3 V | 75% | Medium charge |
| 12.8 V | 50% | Nominal voltage |
| 12.5 V | 25% | Low charge |
| 11.9 V | 10% | Near discharge limit |
| 10.0 V | 0% | Fully discharged |
Why is this important?
Charging beyond 14.6V or discharging below 10V can shorten your battery’s life or cause irreversible damage. Maintaining the voltage within this range helps protect the battery chemistry and prolongs cycle life.
Additionally, LiFePO4 batteries have a very flat discharge curve, meaning the voltage stays fairly constant for most of the discharge cycle before dropping rapidly near the end. This characteristic allows for accurate SOC estimates if you rely on voltage monitoring combined with proper calibration.
How Do You Read a LiFePO4 Battery Voltage Chart Correctly?
Reading a LiFePO4 battery voltage chart might seem straightforward, but knowing how to interpret the numbers in real-life scenarios is crucial for proper battery care. Voltage alone doesn’t tell the whole story, but it’s the most accessible and practical way to gauge your battery’s state of charge.
Start with a stable resting voltage
After charging or discharging, let your battery rest for at least 2 hours without load or charging current. This rest period allows the voltage to stabilize, giving a more accurate reading of the true state of charge.
Use the voltage chart as a reference
Once you measure the resting voltage, compare it to the chart (like the one in the previous section) to estimate your battery’s SOC. For example, if a 12.8V LiFePO4 battery reads 13.3V after resting, it’s about 75% charged.
Understand voltage fluctuations
Voltage can vary under load or while charging. Measuring voltage while the battery is powering a device or being charged may show higher or lower values that don’t reflect the actual SOC.
Complement voltage with other methods
For the most accurate monitoring, consider combining voltage readings with other metrics like current flow, time of use, or using smart battery monitors that track cumulative amp-hours.
Key Takeaways:
- Always measure voltage after resting the battery
- Use voltage ranges from a trusted chart
- Avoid interpreting voltage under load or charging conditions
- Combine with other data for better accuracy
What Happens to LiFePO4 Battery Voltage During Charging and Discharging?
LiFePO4 batteries behave differently than traditional batteries during charging and discharging, especially in how their voltage changes. Understanding these voltage shifts helps you optimize charging practices and avoid damage.
During Charging
When charging, the voltage of each LiFePO4 cell gradually rises from its nominal voltage (around 3.2V) toward its maximum charge voltage (3.65V). The charging process has three key stages:
- Bulk Charge: Voltage steadily rises as the battery accumulates charge.
- Absorption: Voltage nears 3.6-3.65V, and current gradually decreases to avoid overcharging.
- Float/Equalization: This stage is minimal or often skipped in LiFePO4 charging because overcharging can degrade battery life.
Charging a full 12.8V (4-cell) pack usually means the voltage climbs to about 14.4-14.6V. It’s important to use a charger specifically designed for LiFePO4 chemistry to avoid overvoltage, which can cause thermal issues or damage.
During Discharging
LiFePO4 batteries maintain a very flat voltage for much of the discharge cycle, hovering near the nominal voltage (3.2V per cell or 12.8V per pack). This flat curve means voltage drops only slightly as the battery releases energy, giving consistent power output.
Near the end of discharge, the voltage drops quickly from about 3.0V per cell (12V per pack) down to the cutoff voltage near 2.5V per cell (10V per pack). It’s critical to avoid discharging below this cutoff, as it can permanently harm the battery.
Why This Matters:
- The flat voltage curve during discharge makes LiFePO4 batteries excellent for devices requiring steady voltage.
- Understanding voltage behavior during charging ensures you do not overcharge or undercharge, preserving battery health.
- Proper charger settings and voltage monitoring keep your battery safe and maximize its lifespan.
How Can You Use a LiFePO4 Battery Voltage Chart to Prolong Battery Life?
Using a LiFePO4 battery voltage chart wisely is one of the best ways to protect your investment and extend the battery’s usable life. Monitoring voltage regularly helps you avoid damaging conditions like overcharging or deep discharging, both of which shorten battery lifespan.
Avoid Overcharging
Keeping your battery voltage below 14.6V for a 12.8V pack prevents stressing the battery’s cells. Overcharging can cause overheating and chemical breakdown inside the cells. Use a quality LiFePO4 charger with built-in voltage limits or a smart charger to maintain safe levels.
Prevent Deep Discharge
Discharging below 10V can damage the battery permanently by causing cell imbalance and capacity loss. By monitoring your battery’s resting voltage with the chart, you’ll know exactly when it’s time to recharge, avoiding deep discharge.
Use Voltage as a State of Health Indicator
Voltage trends over time can hint at battery health. If the resting voltage drops quickly or the voltage under load falls sharply, it may indicate aging or damage, signaling it’s time for maintenance or replacement.
Balance Charging
Some LiFePO4 battery packs require balancing to ensure all cells charge evenly. Voltage monitoring helps detect imbalance early, preventing weak cells from reducing overall battery performance.
Practical Tips:
- Regularly check resting voltage and compare to the chart
- Use a battery management system (BMS) for automatic protection
- Avoid leaving batteries at full charge or fully discharged for long periods
- Store batteries at around 50% charge if unused for extended times
What Factors Can Affect LiFePO4 Battery Voltage Readings?
While voltage is a convenient way to estimate your LiFePO4 battery’s state of charge, several factors can influence the accuracy of voltage readings. Understanding these will help you interpret your battery’s health more precisely.
Battery Resting State
Voltage measurements taken immediately after charging or discharging can be misleading due to surface charge or voltage recovery. Always allow the battery to rest for at least 2 hours before measuring voltage to get a stable reading.
Temperature Effects
LiFePO4 battery voltage varies with temperature. Cold temperatures tend to lower voltage readings, while high temperatures can increase voltage. Most voltage charts assume readings at around room temperature (20-25°C or 68-77°F). Adjust your expectations accordingly if your battery is in extreme climates.
Load Conditions
Voltage under load (when the battery is powering a device) drops temporarily because of internal resistance. Similarly, voltage while charging can be elevated. To get accurate SOC readings, measure voltage when the battery is neither charging nor discharging.
Battery Age and Health
As batteries age, their internal resistance increases, affecting voltage behavior. Older or damaged batteries may show lower voltages for the same SOC compared to new ones. Monitoring voltage trends over time can reveal deteriorating health.
Calibration and Equipment Accuracy
Using a high-quality, calibrated voltmeter or battery monitor ensures accurate voltage readings. Cheap or uncalibrated devices can lead to inconsistent data, affecting decisions based on voltage.
Conclusion
Understanding how to read and use a LiFePO4 battery voltage chart is essential for anyone relying on lithium iron phosphate batteries—whether in RVs, solar systems, boats, or backup power setups. These batteries offer excellent stability and lifespan, but only when operated within safe voltage ranges.
By regularly monitoring resting voltage, avoiding deep discharges, and preventing overcharging, you preserve battery health and ensure you get the full benefit of your investment. The voltage chart isn’t just a reference—it’s your roadmap to safe, long-lasting, and efficient energy storage.
Whether you’re choosing a battery, setting up a BMS, or just trying to figure out why your system isn’t performing right, voltage is one of your most reliable tools.
Frequently Asked Questions About LiFePO4 Battery Voltage Charts
What is the normal voltage range of a LiFePO4 battery?
A typical LiFePO4 cell operates between 2.5V (fully discharged) and 3.65V (fully charged). For a 12V battery pack (4 cells in series), that’s 10V to 14.6V. Staying within this range ensures optimal performance and battery life.
Can I use voltage alone to determine state of charge (SOC)?
Yes, but only under resting conditions. Voltage under load or during charging fluctuates and doesn’t accurately reflect SOC. For best results, wait at least 1–2 hours after activity before checking.
Why does my fully charged battery show less than 13.8V?
Your battery may have entered a resting state, where surface charge has dissipated. This is normal. As long as it was recently charged to 14.4–14.6V, it’s still near full capacity.
Is it safe to charge LiFePO4 batteries to 100%?
Yes, but frequent charging to full capacity may reduce cycle life slightly. If longevity is more important than full runtime, charging up to 90% (around 14.2V for 12V packs) is often recommended.
What happens if my LiFePO4 battery voltage drops below 10V?
That indicates deep discharge, which can permanently damage the battery if repeated. If your battery is protected by a BMS, it should cut off automatically to prevent this.
Can cold weather affect voltage readings?
Absolutely. Cold temperatures reduce voltage temporarily and may cause the battery to appear undercharged. Conversely, high heat can make the battery voltage appear higher than it really is.
Should I trust voltage readings from my charge controller or inverter?
Not always. Many inverters and solar controllers display voltage under load or charge, which fluctuates. For accurate SOC, use a dedicated battery monitor and refer to a voltage chart.